29
/
en
AIzaSyAYiBZKx7MnpbEhh9jyipgxe19OcubqV5w
April 1, 2024
286800
Zimbabwe
ZWE
true
2
1
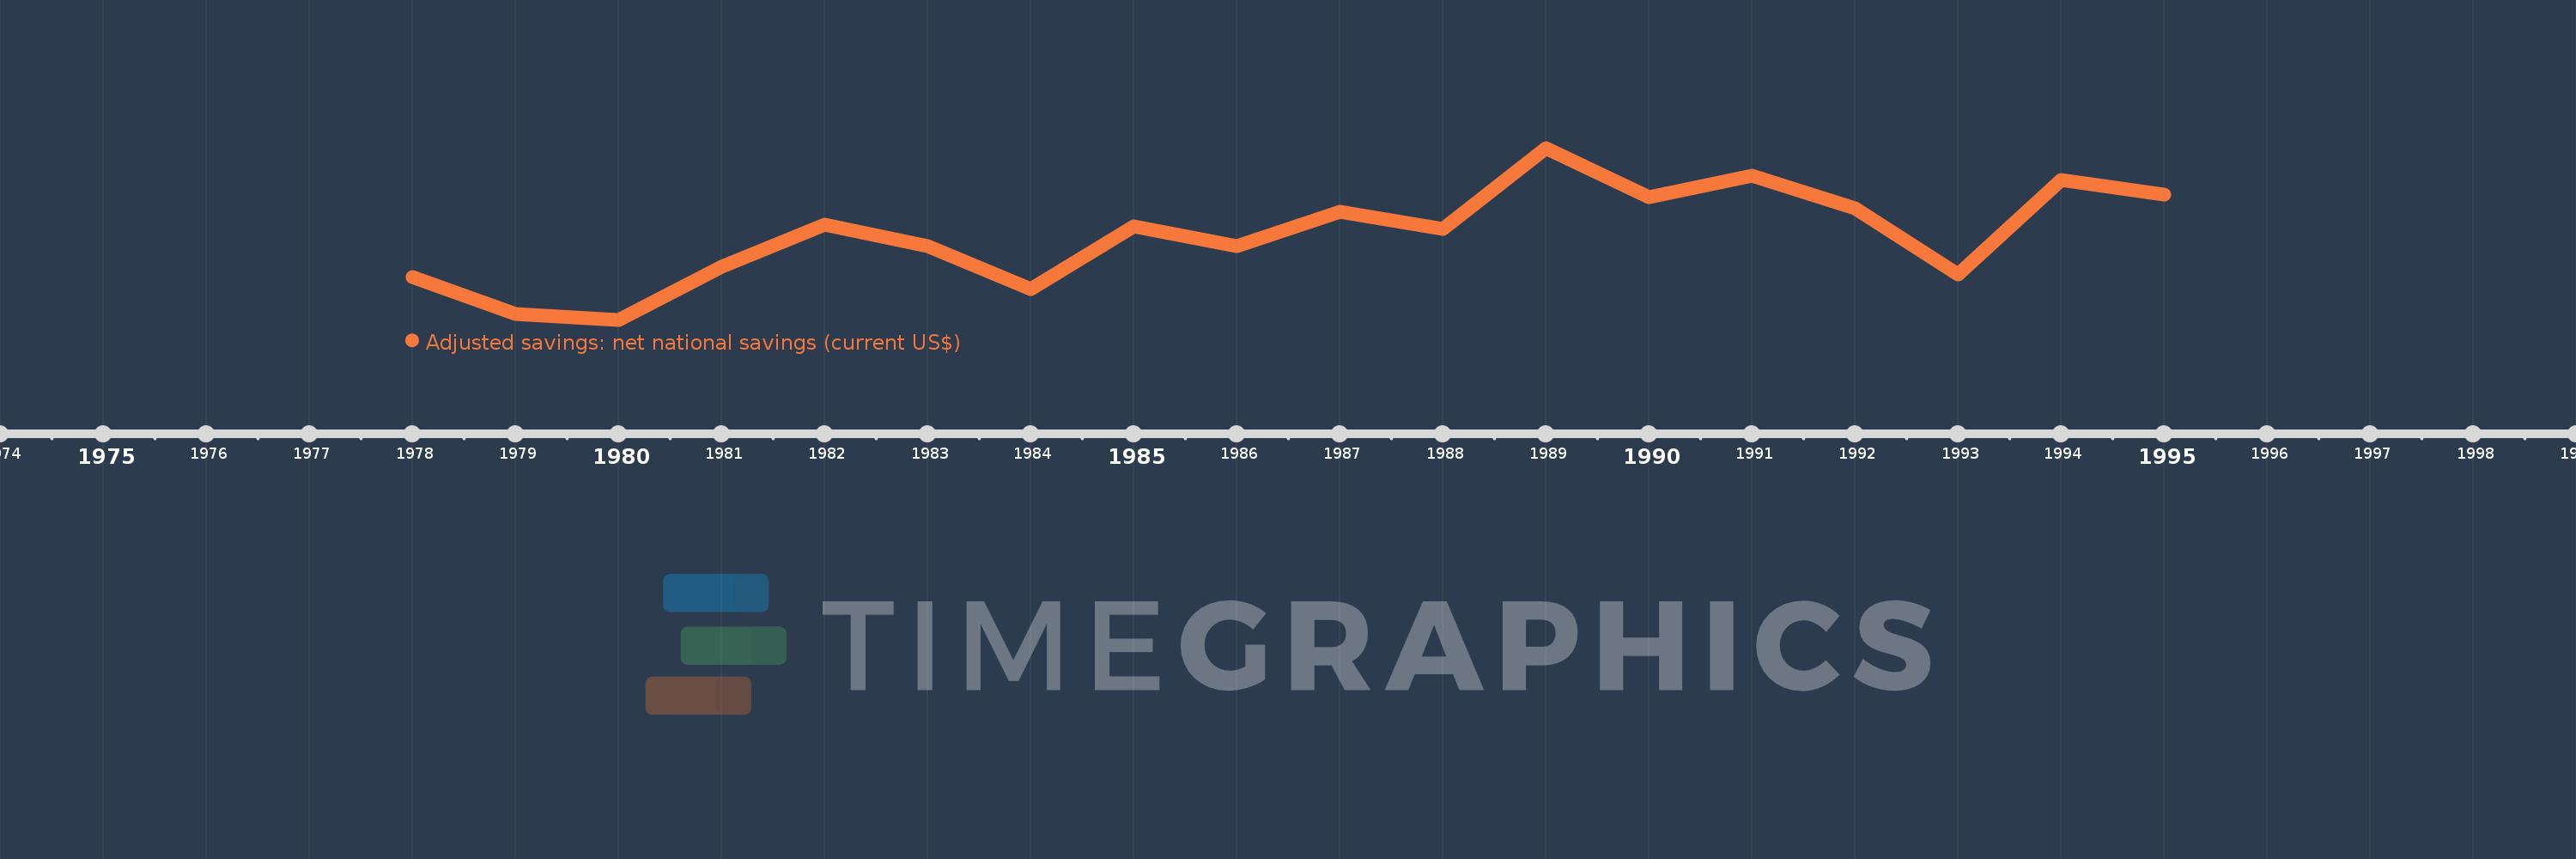
Adjusted savings: net national savings (current US$)
1995,1994,1993,1992,1991,1990,1989,1988,1987,1986,1985,1984,1983,1982,1981,1980,1979,1978
This statistics in other country:
AfghanistanAlbaniaAlgeriaAngolaAntigua and BarbudaArgentinaArmeniaAustraliaAustriaAzerbaijanBahamas, TheBahrainBangladeshBarbadosBelarusBelgiumBelizeBeninBermudaBhutanBoliviaBosnia and HerzegovinaBotswanaBrazilBrunei DarussalamBulgariaBurkina FasoBurundiCabo VerdeCambodiaCameroonCanadaCentral African RepublicChadChileChinaColombiaComorosCongo, Dem. Rep.Congo, Rep.Costa RicaCote d'IvoireCroatiaCyprusCzech RepublicDenmarkDjiboutiDominicaDominican RepublicEcuadorEgypt, Arab Rep.El SalvadorEquatorial GuineaEritreaEstoniaEthiopiaFijiFinlandFranceGabonGambia, TheGeorgiaGermanyGhanaGreeceGrenadaGuatemalaGuineaGuinea-BissauGuyanaHaitiHondurasHong Kong SAR, ChinaHungaryIcelandIndiaIndonesiaIran, Islamic Rep.IraqIrelandIsraelItalyJamaicaJapanJordanKazakhstanKenyaKiribatiKorea, Rep.KosovoKuwaitKyrgyz RepublicLao PDRLatviaLebanonLesothoLiberiaLibyaLithuaniaLuxembourgMacao SAR, ChinaMacedonia, FYRMadagascarMalawiMalaysiaMaldivesMaliMaltaMauritaniaMauritiusMexicoMoldovaMongoliaMontenegroMoroccoMozambiqueNamibiaNepalNetherlandsNew ZealandNicaraguaNigerNigeriaNorwayOmanPakistanPanamaPapua New GuineaParaguayPeruPhilippinesPolandPortugalQatarRomaniaRussian FederationRwandaSaudi ArabiaSenegalSerbiaSeychellesSierra LeoneSingaporeSlovak RepublicSloveniaSolomon IslandsSouth AfricaSpainSri LankaSt. Kitts and NevisSt. LuciaSt. Vincent and the GrenadinesSudanSurinameSwazilandSwedenSwitzerlandSyrian Arab RepublicTajikistanTanzaniaThailandTimor-LesteTogoTongaTrinidad and TobagoTunisiaTurkeyTurkmenistanUgandaUkraineUnited KingdomUnited StatesUruguayVanuatuVenezuela, RBVietnamWest Bank and GazaYemen, Rep.ZambiaZimbabwe Timeline:
This timeline shows a graph from 1978 to 1995 of Zimbabwe. No data until 1977. Number of actual observations by date: 18.
Source name:
World Development Indicators
Source organization:
World Bank staff estimates based on sources and methods in World Bank's "The Changing Wealth of Nations: Measuring Sustainable Development in the New Millennium" (2011).
Categories, topics:
Economy & Growth, Environment
Last updated:
apr 23, 2017
Indicators value changes by year
Minimum:
421.548 mln
jan 1, 1980
Maximum:
1.505 bln
jan 1, 1989
At the date of observation
Value
Absolute change
Change from previous value
jan 1, 1978
689.679 mln
+689.679 mln
0.0%
jan 1, 1979
456.367 mln
-233.312 mln
-33.83%
jan 1, 1980
421.548 mln
-34.819 mln
-7.63%
jan 1, 1981
753.831 mln
+332.283 mln
78.82%
jan 1, 1982
1.023 bln
+269.082 mln
35.7%
jan 1, 1983
888.402 mln
-134.51 mln
-13.15%
jan 1, 1984
616.465 mln
-271.938 mln
-30.61%
jan 1, 1985
1.009 bln
+392.286 mln
63.63%
jan 1, 1986
885.989 mln
-122.762 mln
-12.17%
jan 1, 1987
1.101 bln
+214.677 mln
24.23%
jan 1, 1988
996.214 mln
-104.452 mln
-9.49%
jan 1, 1989
1.505 bln
+509.09 mln
51.1%
jan 1, 1990
1.193 bln
-312.469 mln
-20.76%
jan 1, 1991
1.332 bln
+139.188 mln
11.67%
jan 1, 1992
1.125 bln
-206.979 mln
-15.54%
jan 1, 1993
709.212 mln
-415.833 mln
-36.96%
jan 1, 1994
1.306 bln
+596.435 mln
84.1%
jan 1, 1995
1.212 bln
-93.425 mln
-7.16%
Ranking of countries by current statistics by years


Comments: