29
/
en
AIzaSyAYiBZKx7MnpbEhh9jyipgxe19OcubqV5w
April 1, 2024
183489
Macedonia, FYR
MKD
true
2
1
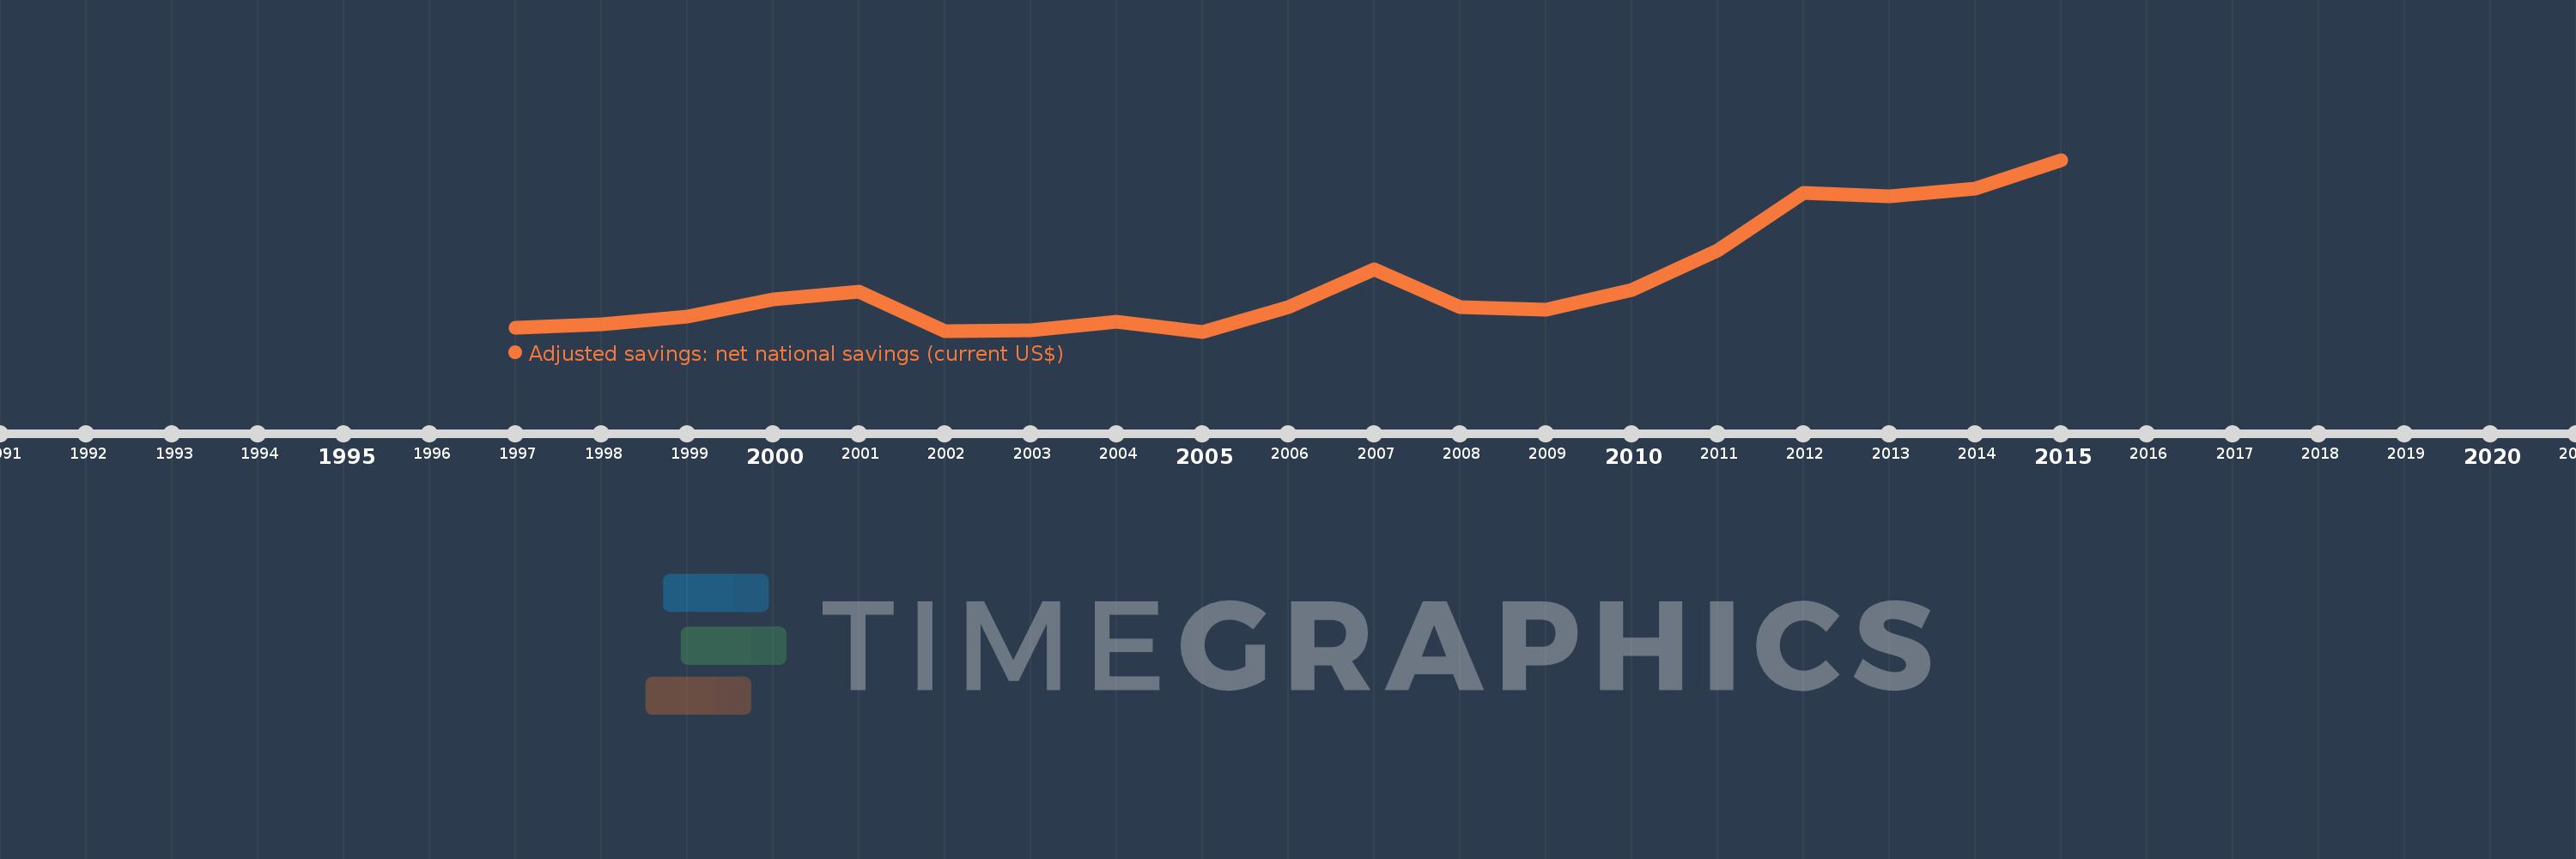
Adjusted savings: net national savings (current US$)
2015,2014,2013,2012,2011,2010,2009,2008,2007,2006,2005,2004,2003,2002,2001,2000,1999,1998,1997
This statistics in other country:
AfghanistanAlbaniaAlgeriaAngolaAntigua and BarbudaArgentinaArmeniaAustraliaAustriaAzerbaijanBahamas, TheBahrainBangladeshBarbadosBelarusBelgiumBelizeBeninBermudaBhutanBoliviaBosnia and HerzegovinaBotswanaBrazilBrunei DarussalamBulgariaBurkina FasoBurundiCabo VerdeCambodiaCameroonCanadaCentral African RepublicChadChileChinaColombiaComorosCongo, Dem. Rep.Congo, Rep.Costa RicaCote d'IvoireCroatiaCyprusCzech RepublicDenmarkDjiboutiDominicaDominican RepublicEcuadorEgypt, Arab Rep.El SalvadorEquatorial GuineaEritreaEstoniaEthiopiaFijiFinlandFranceGabonGambia, TheGeorgiaGermanyGhanaGreeceGrenadaGuatemalaGuineaGuinea-BissauGuyanaHaitiHondurasHong Kong SAR, ChinaHungaryIcelandIndiaIndonesiaIran, Islamic Rep.IraqIrelandIsraelItalyJamaicaJapanJordanKazakhstanKenyaKiribatiKorea, Rep.KosovoKuwaitKyrgyz RepublicLao PDRLatviaLebanonLesothoLiberiaLibyaLithuaniaLuxembourgMacao SAR, ChinaMacedonia, FYRMadagascarMalawiMalaysiaMaldivesMaliMaltaMauritaniaMauritiusMexicoMoldovaMongoliaMontenegroMoroccoMozambiqueNamibiaNepalNetherlandsNew ZealandNicaraguaNigerNigeriaNorwayOmanPakistanPanamaPapua New GuineaParaguayPeruPhilippinesPolandPortugalQatarRomaniaRussian FederationRwandaSaudi ArabiaSenegalSerbiaSeychellesSierra LeoneSingaporeSlovak RepublicSloveniaSolomon IslandsSouth AfricaSpainSri LankaSt. Kitts and NevisSt. LuciaSt. Vincent and the GrenadinesSudanSurinameSwazilandSwedenSwitzerlandSyrian Arab RepublicTajikistanTanzaniaThailandTimor-LesteTogoTongaTrinidad and TobagoTunisiaTurkeyTurkmenistanUgandaUkraineUnited KingdomUnited StatesUruguayVanuatuVenezuela, RBVietnamWest Bank and GazaYemen, Rep.ZambiaZimbabwe Timeline:
This timeline shows a graph from 1997 to 2015 of Macedonia, FYR. No data until 1996. Number of actual observations by date: 19.
Source name:
World Development Indicators
Source organization:
World Bank staff estimates based on sources and methods in World Bank's "The Changing Wealth of Nations: Measuring Sustainable Development in the New Millennium" (2011).
Categories, topics:
Economy & Growth, Environment
Last updated:
apr 23, 2017
Indicators value changes by year
Minimum:
-182.577 mln
jan 1, 2005
Maximum:
1.505 bln
jan 1, 2015
At the date of observation
Value
Absolute change
Change from previous value
jan 1, 1997
-142.921 mln
-142.921 mln
0.0%
jan 1, 1998
-113.638 mln
+29.283 mln
-20.49%
jan 1, 1999
-38.164 mln
+75.474 mln
-66.42%
jan 1, 2000
136.492 mln
+174.656 mln
-457.64%
jan 1, 2001
210.412 mln
+73.92 mln
54.16%
jan 1, 2002
-177.723 mln
-388.136 mln
-184.46%
jan 1, 2003
-173.027 mln
+4.696 mln
-2.64%
jan 1, 2004
-86.908 mln
+86.119 mln
-49.77%
jan 1, 2005
-182.577 mln
-95.669 mln
110.08%
jan 1, 2006
59.39 mln
+241.967 mln
-132.53%
jan 1, 2007
431.363 mln
+371.974 mln
626.32%
jan 1, 2008
54.29 mln
-377.074 mln
-87.41%
jan 1, 2009
30.703 mln
-23.586 mln
-43.45%
jan 1, 2010
230.008 mln
+199.305 mln
649.14%
jan 1, 2011
618.442 mln
+388.434 mln
168.88%
jan 1, 2012
1.178 bln
+559.2 mln
90.42%
jan 1, 2013
1.147 bln
-30.177 mln
-2.56%
jan 1, 2014
1.219 bln
+71.222 mln
6.21%
jan 1, 2015
1.505 bln
+286.314 mln
23.49%
Ranking of countries by current statistics by years


Comments: