29
/
en
AIzaSyAYiBZKx7MnpbEhh9jyipgxe19OcubqV5w
April 1, 2024
209037
New Zealand
NZL
true
2
1
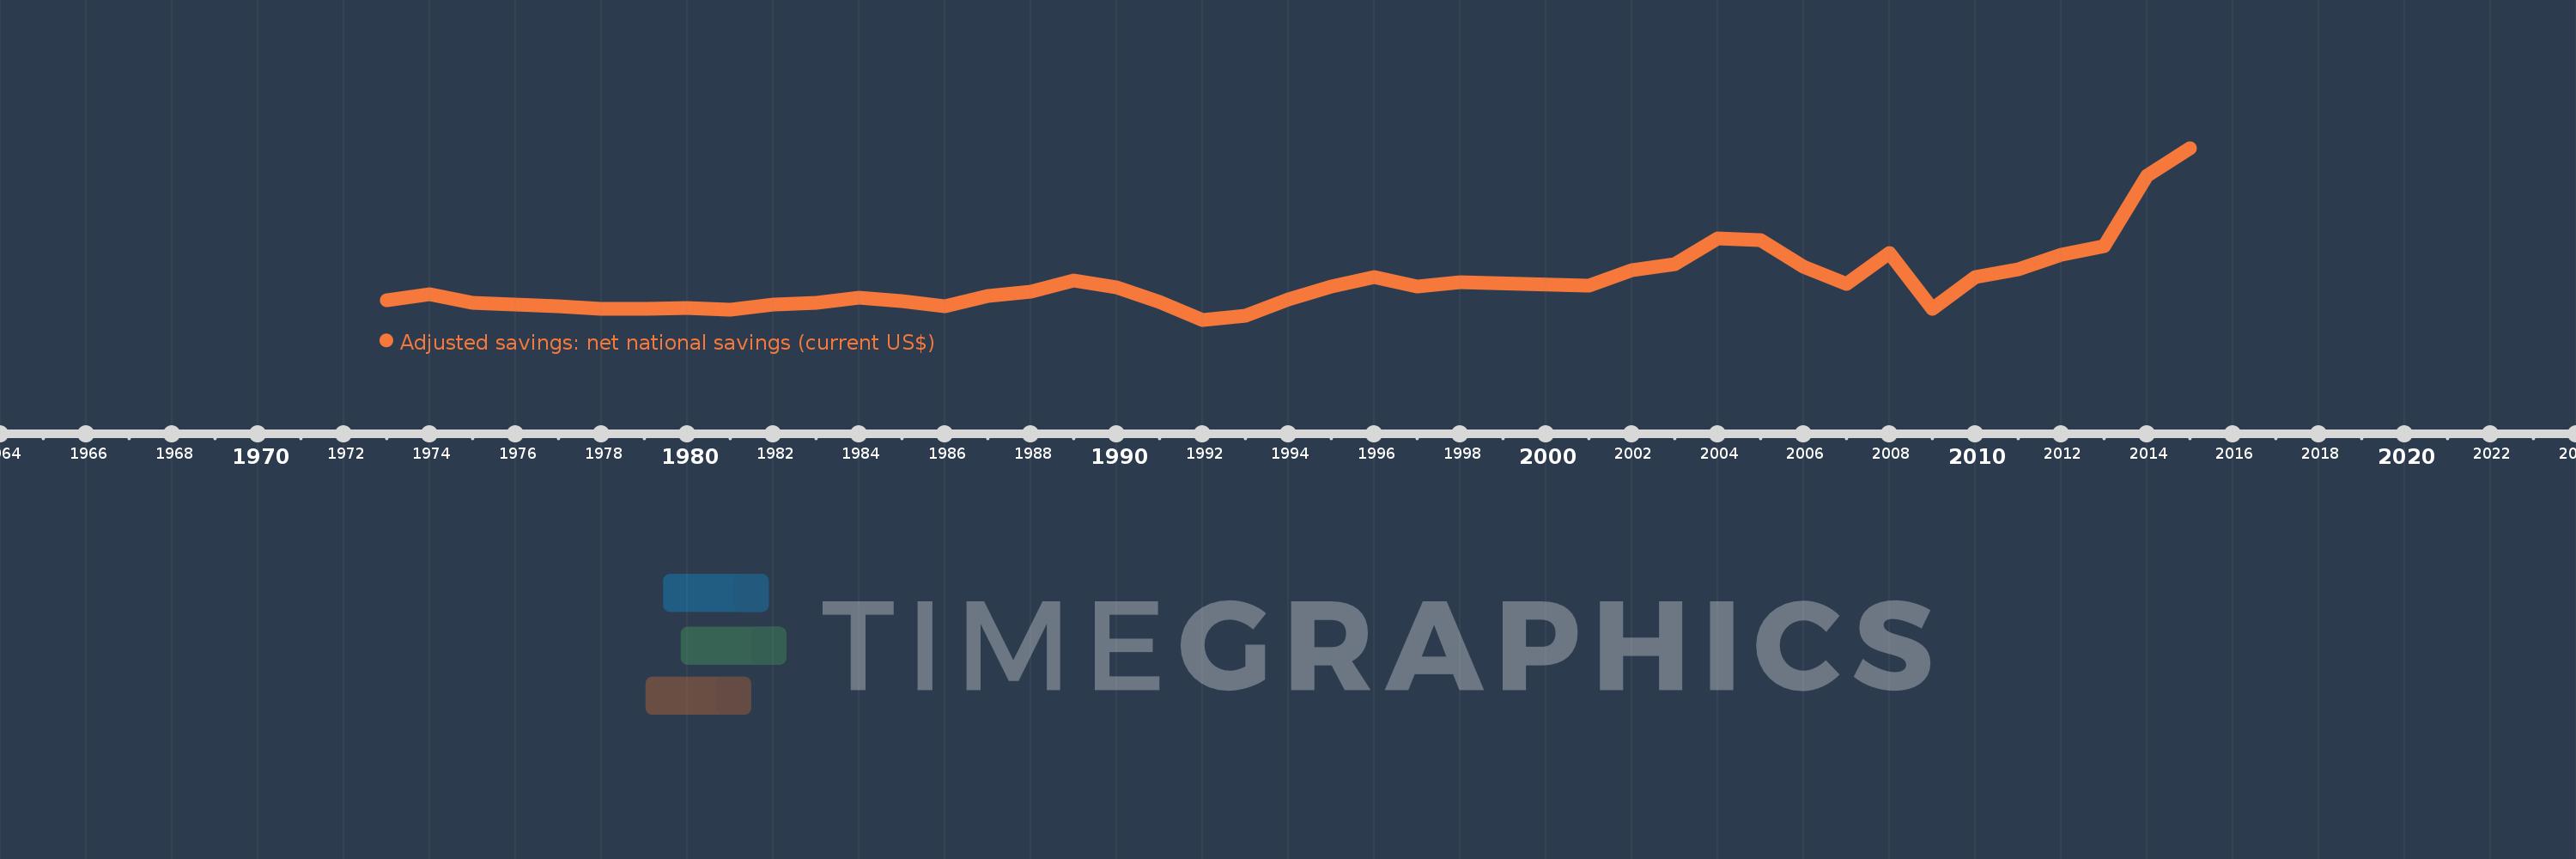
Adjusted savings: net national savings (current US$)
2015,2014,2013,2012,2011,2010,2009,2008,2007,2006,2005,2004,2003,2002,2001,1998,1997,1996,1995,1994,1993,1992,1991,1990,1989,1988,1987,1986,1985,1984,1983,1982,1981,1980,1979,1978,1977,1975,1974,1973
This statistics in other country:
AfghanistanAlbaniaAlgeriaAngolaAntigua and BarbudaArgentinaArmeniaAustraliaAustriaAzerbaijanBahamas, TheBahrainBangladeshBarbadosBelarusBelgiumBelizeBeninBermudaBhutanBoliviaBosnia and HerzegovinaBotswanaBrazilBrunei DarussalamBulgariaBurkina FasoBurundiCabo VerdeCambodiaCameroonCanadaCentral African RepublicChadChileChinaColombiaComorosCongo, Dem. Rep.Congo, Rep.Costa RicaCote d'IvoireCroatiaCyprusCzech RepublicDenmarkDjiboutiDominicaDominican RepublicEcuadorEgypt, Arab Rep.El SalvadorEquatorial GuineaEritreaEstoniaEthiopiaFijiFinlandFranceGabonGambia, TheGeorgiaGermanyGhanaGreeceGrenadaGuatemalaGuineaGuinea-BissauGuyanaHaitiHondurasHong Kong SAR, ChinaHungaryIcelandIndiaIndonesiaIran, Islamic Rep.IraqIrelandIsraelItalyJamaicaJapanJordanKazakhstanKenyaKiribatiKorea, Rep.KosovoKuwaitKyrgyz RepublicLao PDRLatviaLebanonLesothoLiberiaLibyaLithuaniaLuxembourgMacao SAR, ChinaMacedonia, FYRMadagascarMalawiMalaysiaMaldivesMaliMaltaMauritaniaMauritiusMexicoMoldovaMongoliaMontenegroMoroccoMozambiqueNamibiaNepalNetherlandsNew ZealandNicaraguaNigerNigeriaNorwayOmanPakistanPanamaPapua New GuineaParaguayPeruPhilippinesPolandPortugalQatarRomaniaRussian FederationRwandaSaudi ArabiaSenegalSerbiaSeychellesSierra LeoneSingaporeSlovak RepublicSloveniaSolomon IslandsSouth AfricaSpainSri LankaSt. Kitts and NevisSt. LuciaSt. Vincent and the GrenadinesSudanSurinameSwazilandSwedenSwitzerlandSyrian Arab RepublicTajikistanTanzaniaThailandTimor-LesteTogoTongaTrinidad and TobagoTunisiaTurkeyTurkmenistanUgandaUkraineUnited KingdomUnited StatesUruguayVanuatuVenezuela, RBVietnamWest Bank and GazaYemen, Rep.ZambiaZimbabwe Timeline:
This timeline shows a graph from 1973 to 2015 of New Zealand. No data until 1972. Number of actual observations by date: 40.
Source name:
World Development Indicators
Source organization:
World Bank staff estimates based on sources and methods in World Bank's "The Changing Wealth of Nations: Measuring Sustainable Development in the New Millennium" (2011).
Categories, topics:
Economy & Growth, Environment
Last updated:
apr 23, 2017
Indicators value changes by year
Minimum:
-297.645 mln
jan 1, 1992
Maximum:
14.64 bln
jan 1, 2015
At the date of observation
Value
Absolute change
Change from previous value
jan 1, 1973
1.366 bln
+1.366 bln
0.0%
jan 1, 1974
1.895 bln
+528.988 mln
38.73%
jan 1, 1975
1.206 bln
-688.744 mln
-36.35%
jan 1, 1977
850.958 mln
-355.154 mln
-29.45%
jan 1, 1978
664.361 mln
-186.597 mln
-21.93%
jan 1, 1979
626.151 mln
-38.21 mln
-5.75%
jan 1, 1980
699.78 mln
+73.629 mln
11.76%
jan 1, 1981
551.134 mln
-148.646 mln
-21.24%
jan 1, 1982
1.06 bln
+508.859 mln
92.33%
jan 1, 1983
1.156 bln
+95.973 mln
9.05%
jan 1, 1984
1.6 bln
+444.323 mln
38.44%
jan 1, 1985
1.32 bln
-280.677 mln
-17.54%
jan 1, 1986
872.1 mln
-447.512 mln
-33.91%
jan 1, 1987
1.753 bln
+880.814 mln
101.0%
jan 1, 1988
2.136 bln
+382.685 mln
21.83%
jan 1, 1989
3.083 bln
+947.361 mln
44.36%
jan 1, 1990
2.521 bln
-562.321 mln
-18.24%
jan 1, 1991
1.221 bln
-1.299 bln
-51.55%
jan 1, 1992
-297.645 mln
-1.519 bln
-124.37%
jan 1, 1993
36.257 mln
+333.902 mln
-112.18%
jan 1, 1994
1.451 bln
+1.415 bln
3.9K%
jan 1, 1995
2.585 bln
+1.135 bln
78.2%
jan 1, 1996
3.38 bln
+794.265 mln
30.72%
jan 1, 1997
2.604 bln
-775.888 mln
-22.96%
jan 1, 1998
2.98 bln
+376.164 mln
14.45%
jan 1, 2001
2.689 bln
-290.702 mln
-9.76%
jan 1, 2002
3.984 bln
+1.294 bln
48.13%
jan 1, 2003
4.569 bln
+585.552 mln
14.7%
jan 1, 2004
6.803 bln
+2.234 bln
48.88%
jan 1, 2005
6.634 bln
-169.138 mln
-2.49%
jan 1, 2006
4.341 bln
-2.293 bln
-34.57%
jan 1, 2007
2.844 bln
-1.497 bln
-34.49%
jan 1, 2008
5.502 bln
+2.659 bln
93.5%
jan 1, 2009
680.906 mln
-4.821 bln
-87.62%
jan 1, 2010
3.451 bln
+2.77 bln
406.82%
jan 1, 2011
4.093 bln
+642.211 mln
18.61%
jan 1, 2012
5.328 bln
+1.235 bln
30.17%
jan 1, 2013
6.078 bln
+750.001 mln
14.08%
jan 1, 2014
12.259 bln
+6.181 bln
101.69%
jan 1, 2015
14.64 bln
+2.38 bln
19.42%
Ranking of countries by current statistics by years


Comments: