29
/
en
AIzaSyAYiBZKx7MnpbEhh9jyipgxe19OcubqV5w
April 1, 2024
83688
Benin
BEN
true
2
1
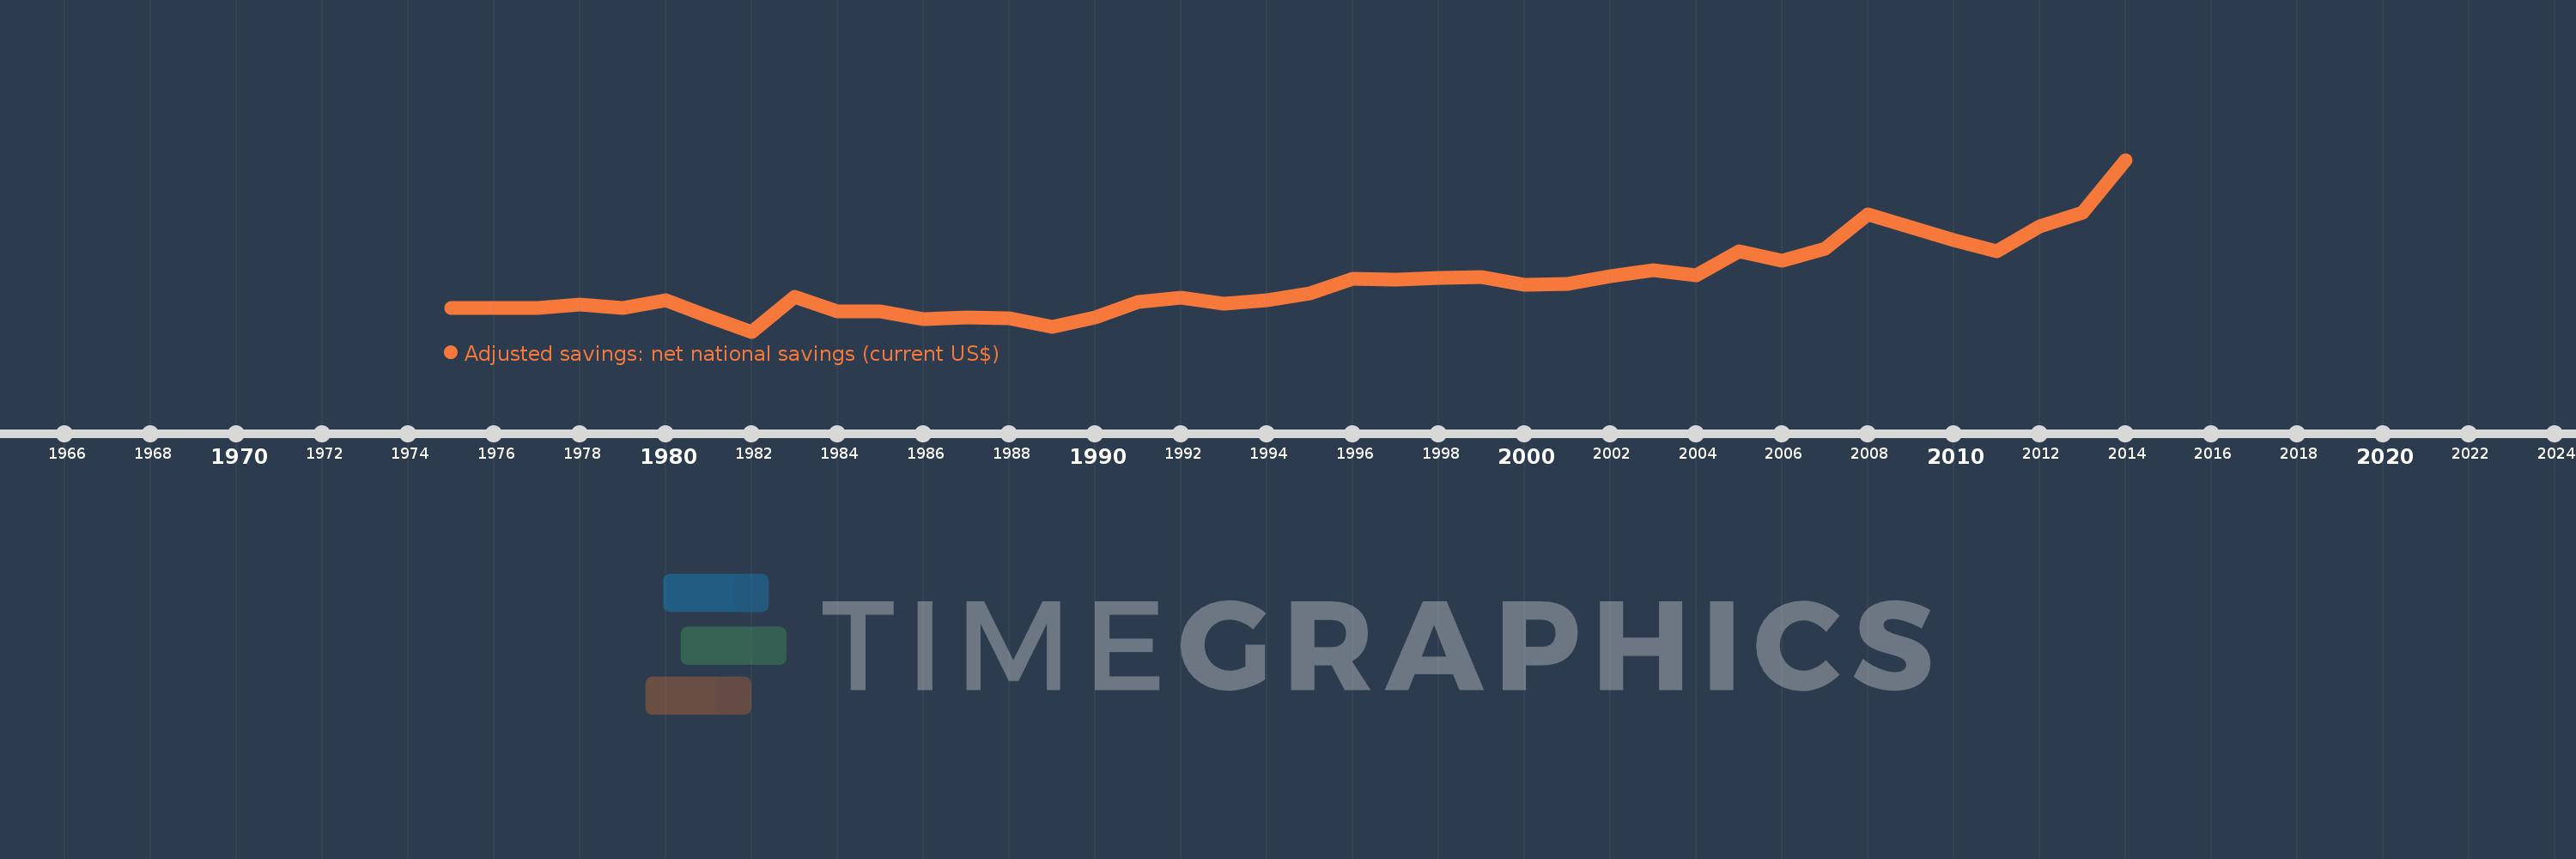
Adjusted savings: net national savings (current US$)
2014,2013,2012,2011,2010,2009,2008,2007,2006,2005,2004,2003,2002,2001,2000,1999,1998,1997,1996,1995,1994,1993,1992,1991,1990,1989,1988,1987,1986,1985,1984,1983,1982,1981,1980,1979,1978,1977,1976,1975
This statistics in other country:
AfghanistanAlbaniaAlgeriaAngolaAntigua and BarbudaArgentinaArmeniaAustraliaAustriaAzerbaijanBahamas, TheBahrainBangladeshBarbadosBelarusBelgiumBelizeBeninBermudaBhutanBoliviaBosnia and HerzegovinaBotswanaBrazilBrunei DarussalamBulgariaBurkina FasoBurundiCabo VerdeCambodiaCameroonCanadaCentral African RepublicChadChileChinaColombiaComorosCongo, Dem. Rep.Congo, Rep.Costa RicaCote d'IvoireCroatiaCyprusCzech RepublicDenmarkDjiboutiDominicaDominican RepublicEcuadorEgypt, Arab Rep.El SalvadorEquatorial GuineaEritreaEstoniaEthiopiaFijiFinlandFranceGabonGambia, TheGeorgiaGermanyGhanaGreeceGrenadaGuatemalaGuineaGuinea-BissauGuyanaHaitiHondurasHong Kong SAR, ChinaHungaryIcelandIndiaIndonesiaIran, Islamic Rep.IraqIrelandIsraelItalyJamaicaJapanJordanKazakhstanKenyaKiribatiKorea, Rep.KosovoKuwaitKyrgyz RepublicLao PDRLatviaLebanonLesothoLiberiaLibyaLithuaniaLuxembourgMacao SAR, ChinaMacedonia, FYRMadagascarMalawiMalaysiaMaldivesMaliMaltaMauritaniaMauritiusMexicoMoldovaMongoliaMontenegroMoroccoMozambiqueNamibiaNepalNetherlandsNew ZealandNicaraguaNigerNigeriaNorwayOmanPakistanPanamaPapua New GuineaParaguayPeruPhilippinesPolandPortugalQatarRomaniaRussian FederationRwandaSaudi ArabiaSenegalSerbiaSeychellesSierra LeoneSingaporeSlovak RepublicSloveniaSolomon IslandsSouth AfricaSpainSri LankaSt. Kitts and NevisSt. LuciaSt. Vincent and the GrenadinesSudanSurinameSwazilandSwedenSwitzerlandSyrian Arab RepublicTajikistanTanzaniaThailandTimor-LesteTogoTongaTrinidad and TobagoTunisiaTurkeyTurkmenistanUgandaUkraineUnited KingdomUnited StatesUruguayVanuatuVenezuela, RBVietnamWest Bank and GazaYemen, Rep.ZambiaZimbabwe Timeline:
This timeline shows a graph from 1975 to 2014 of Benin. No data until 1974. Number of actual observations by date: 40.
Source name:
World Development Indicators
Source organization:
World Bank staff estimates based on sources and methods in World Bank's "The Changing Wealth of Nations: Measuring Sustainable Development in the New Millennium" (2011).
Categories, topics:
Economy & Growth, Environment
Last updated:
apr 23, 2017
Indicators value changes by year
Minimum:
-113.12 mln
jan 1, 1982
Maximum:
966.868 mln
jan 1, 2014
At the date of observation
Value
Absolute change
Change from previous value
jan 1, 1975
35.796 mln
+35.796 mln
0.0%
jan 1, 1976
35.597 mln
-199.313K
-0.56%
jan 1, 1977
33.879 mln
-1.718 mln
-4.83%
jan 1, 1978
57.798 mln
+23.919 mln
70.6%
jan 1, 1979
37.461 mln
-20.337 mln
-35.19%
jan 1, 1980
82.474 mln
+45.014 mln
120.16%
jan 1, 1981
-16.579 mln
-99.053 mln
-120.1%
jan 1, 1982
-113.12 mln
-96.541 mln
582.32%
jan 1, 1983
106.089 mln
+219.209 mln
-193.78%
jan 1, 1984
15.164 mln
-90.925 mln
-85.71%
jan 1, 1985
11.152 mln
-4.012 mln
-26.46%
jan 1, 1986
-33.664 mln
-44.816 mln
-401.86%
jan 1, 1987
-25.402 mln
+8.262 mln
-24.54%
jan 1, 1988
-27.692 mln
-2.29 mln
9.02%
jan 1, 1989
-85.636 mln
-57.943 mln
209.24%
jan 1, 1990
-25.032 mln
+60.604 mln
-70.77%
jan 1, 1991
75.531 mln
+100.563 mln
-401.74%
jan 1, 1992
97.849 mln
+22.317 mln
29.55%
jan 1, 1993
60.016 mln
-37.833 mln
-38.66%
jan 1, 1994
84.694 mln
+24.678 mln
41.12%
jan 1, 1995
129.812 mln
+45.118 mln
53.27%
jan 1, 1996
217.151 mln
+87.339 mln
67.28%
jan 1, 1997
213.328 mln
-3.823 mln
-1.76%
jan 1, 1998
225.634 mln
+12.306 mln
5.77%
jan 1, 1999
230.63 mln
+4.995 mln
2.21%
jan 1, 2000
181.134 mln
-49.496 mln
-21.46%
jan 1, 2001
186.78 mln
+5.646 mln
3.12%
jan 1, 2002
237.542 mln
+50.761 mln
27.18%
jan 1, 2003
270.456 mln
+32.915 mln
13.86%
jan 1, 2004
242.028 mln
-28.428 mln
-10.51%
jan 1, 2005
390.163 mln
+148.136 mln
61.21%
jan 1, 2006
333.621 mln
-56.543 mln
-14.49%
jan 1, 2007
408.423 mln
+74.803 mln
22.42%
jan 1, 2008
622.309 mln
+213.885 mln
52.37%
jan 1, 2009
541.507 mln
-80.801 mln
-12.98%
jan 1, 2010
463.168 mln
-78.339 mln
-14.47%
jan 1, 2011
389.15 mln
-74.018 mln
-15.98%
jan 1, 2012
546.815 mln
+157.665 mln
40.52%
jan 1, 2013
636.038 mln
+89.223 mln
16.32%
jan 1, 2014
966.868 mln
+330.83 mln
52.01%
Ranking of countries by current statistics by years


Comments: