29
/
en
AIzaSyAYiBZKx7MnpbEhh9jyipgxe19OcubqV5w
April 1, 2024
273172
Ukraine
UKR
true
2
1
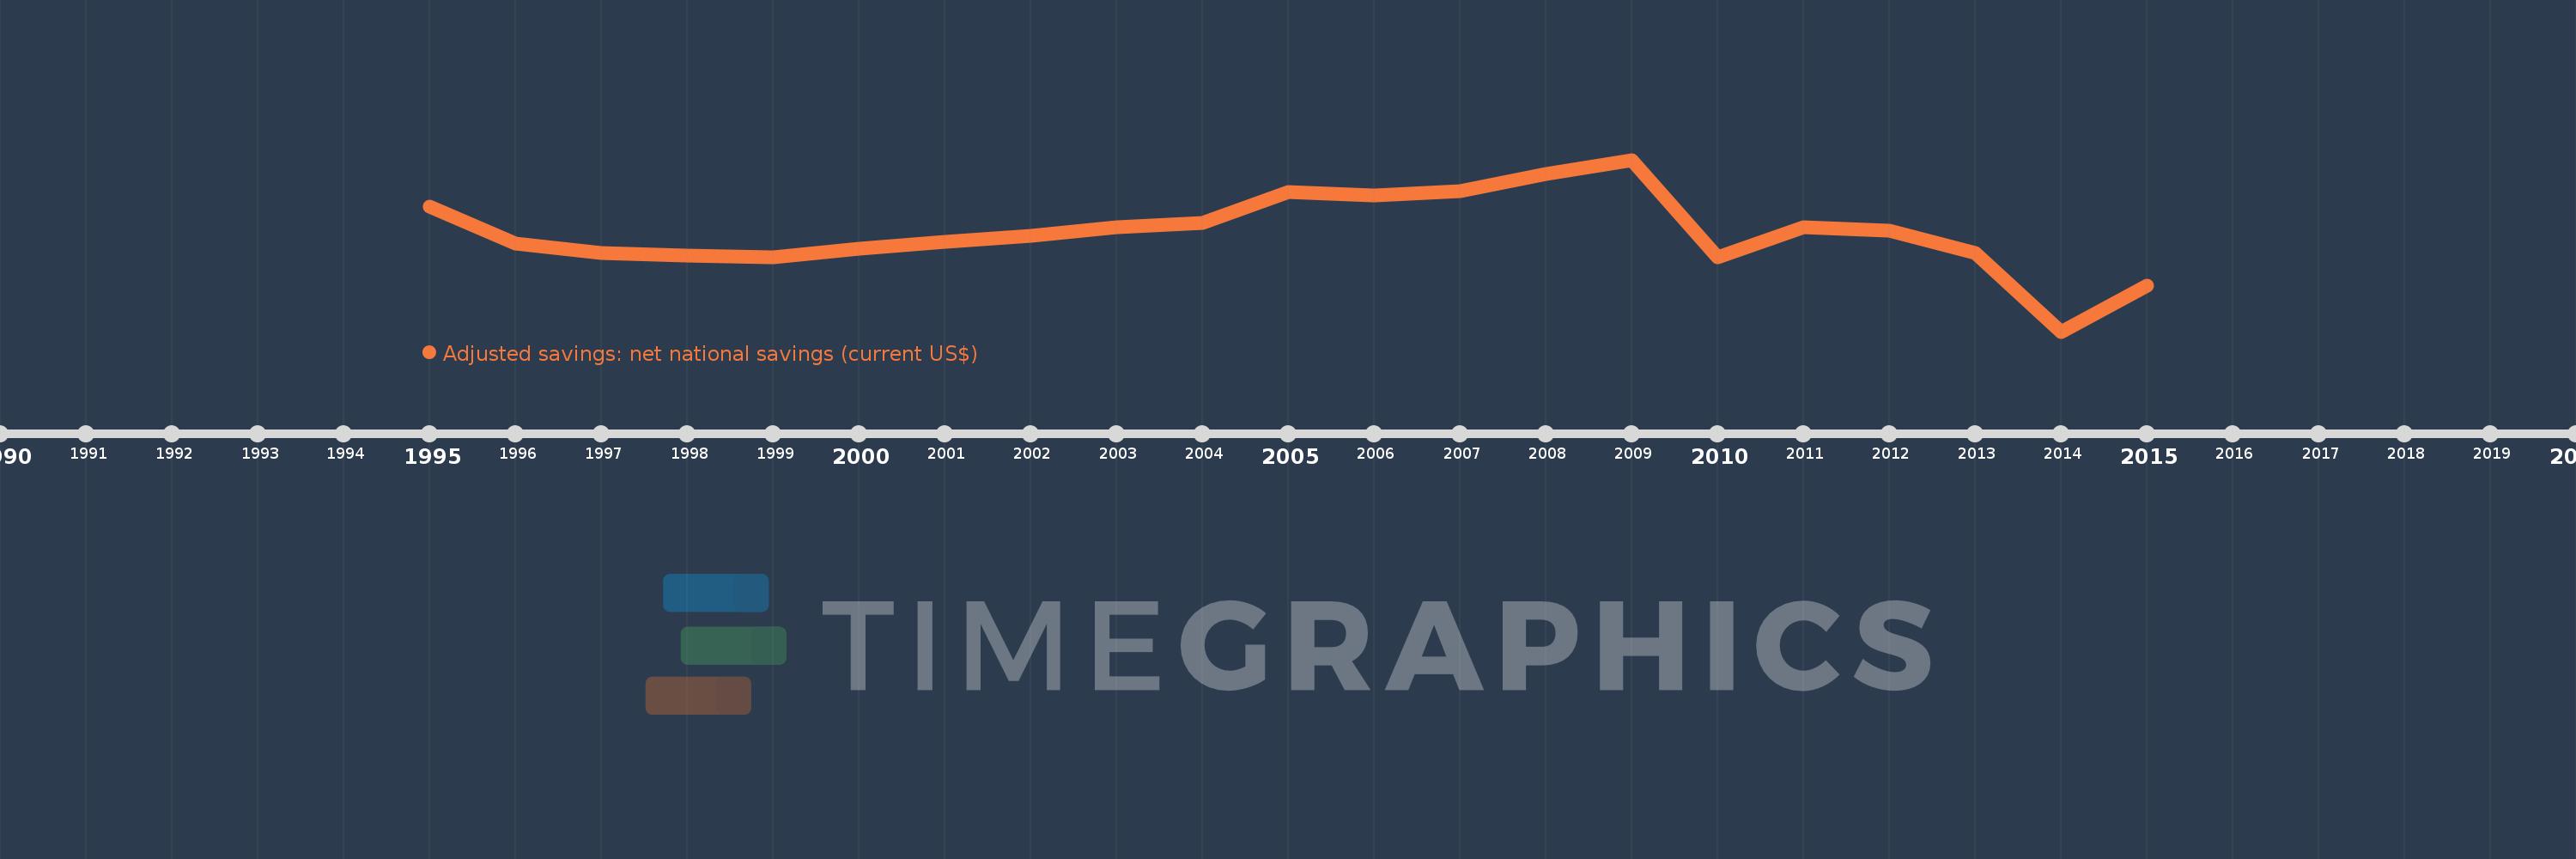
Adjusted savings: net national savings (current US$)
2015,2014,2013,2012,2011,2010,2009,2008,2007,2006,2005,2004,2003,2002,2001,2000,1999,1998,1997,1996,1995
This statistics in other country:
AfghanistanAlbaniaAlgeriaAngolaAntigua and BarbudaArgentinaArmeniaAustraliaAustriaAzerbaijanBahamas, TheBahrainBangladeshBarbadosBelarusBelgiumBelizeBeninBermudaBhutanBoliviaBosnia and HerzegovinaBotswanaBrazilBrunei DarussalamBulgariaBurkina FasoBurundiCabo VerdeCambodiaCameroonCanadaCentral African RepublicChadChileChinaColombiaComorosCongo, Dem. Rep.Congo, Rep.Costa RicaCote d'IvoireCroatiaCyprusCzech RepublicDenmarkDjiboutiDominicaDominican RepublicEcuadorEgypt, Arab Rep.El SalvadorEquatorial GuineaEritreaEstoniaEthiopiaFijiFinlandFranceGabonGambia, TheGeorgiaGermanyGhanaGreeceGrenadaGuatemalaGuineaGuinea-BissauGuyanaHaitiHondurasHong Kong SAR, ChinaHungaryIcelandIndiaIndonesiaIran, Islamic Rep.IraqIrelandIsraelItalyJamaicaJapanJordanKazakhstanKenyaKiribatiKorea, Rep.KosovoKuwaitKyrgyz RepublicLao PDRLatviaLebanonLesothoLiberiaLibyaLithuaniaLuxembourgMacao SAR, ChinaMacedonia, FYRMadagascarMalawiMalaysiaMaldivesMaliMaltaMauritaniaMauritiusMexicoMoldovaMongoliaMontenegroMoroccoMozambiqueNamibiaNepalNetherlandsNew ZealandNicaraguaNigerNigeriaNorwayOmanPakistanPanamaPapua New GuineaParaguayPeruPhilippinesPolandPortugalQatarRomaniaRussian FederationRwandaSaudi ArabiaSenegalSerbiaSeychellesSierra LeoneSingaporeSlovak RepublicSloveniaSolomon IslandsSouth AfricaSpainSri LankaSt. Kitts and NevisSt. LuciaSt. Vincent and the GrenadinesSudanSurinameSwazilandSwedenSwitzerlandSyrian Arab RepublicTajikistanTanzaniaThailandTimor-LesteTogoTongaTrinidad and TobagoTunisiaTurkeyTurkmenistanUgandaUkraineUnited KingdomUnited StatesUruguayVanuatuVenezuela, RBVietnamWest Bank and GazaYemen, Rep.ZambiaZimbabwe Timeline:
This timeline shows a graph from 1995 to 2015 of Ukraine. No data until 1994. Number of actual observations by date: 21.
Source name:
World Development Indicators
Source organization:
World Bank staff estimates based on sources and methods in World Bank's "The Changing Wealth of Nations: Measuring Sustainable Development in the New Millennium" (2011).
Categories, topics:
Economy & Growth, Environment
Last updated:
apr 23, 2017
Indicators value changes by year
Minimum:
-11.078 bln
jan 1, 2014
Maximum:
14.227 bln
jan 1, 2009
At the date of observation
Value
Absolute change
Change from previous value
jan 1, 1995
7.363 bln
+7.363 bln
0.0%
jan 1, 1996
1.845 bln
-5.518 bln
-74.94%
jan 1, 1997
444.227 mln
-1.401 bln
-75.93%
jan 1, 1998
90.586 mln
-353.641 mln
-79.61%
jan 1, 1999
-129.725 mln
-220.311 mln
-243.21%
jan 1, 2000
1.125 bln
+1.255 bln
-967.37%
jan 1, 2001
2.14 bln
+1.015 bln
90.18%
jan 1, 2002
3.036 bln
+895.801 mln
41.86%
jan 1, 2003
4.249 bln
+1.213 bln
39.97%
jan 1, 2004
4.887 bln
+637.948 mln
15.01%
jan 1, 2005
9.464 bln
+4.577 bln
93.65%
jan 1, 2006
9.038 bln
-426.175 mln
-4.5%
jan 1, 2007
9.589 bln
+550.964 mln
6.1%
jan 1, 2008
12.165 bln
+2.577 bln
26.87%
jan 1, 2009
14.227 bln
+2.062 bln
16.95%
jan 1, 2010
-181.086 mln
-14.408 bln
-101.27%
jan 1, 2011
4.26 bln
+4.441 bln
-2.45K%
jan 1, 2012
3.785 bln
-475.234 mln
-11.16%
jan 1, 2013
528.375 mln
-3.256 bln
-86.04%
jan 1, 2014
-11.078 bln
-11.607 bln
-2.2K%
jan 1, 2015
-4.322 bln
+6.757 bln
-60.99%
Ranking of countries by current statistics by years


Comments: