29
/
en
AIzaSyAYiBZKx7MnpbEhh9jyipgxe19OcubqV5w
April 1, 2024
240186
Singapore
SGP
true
2
1
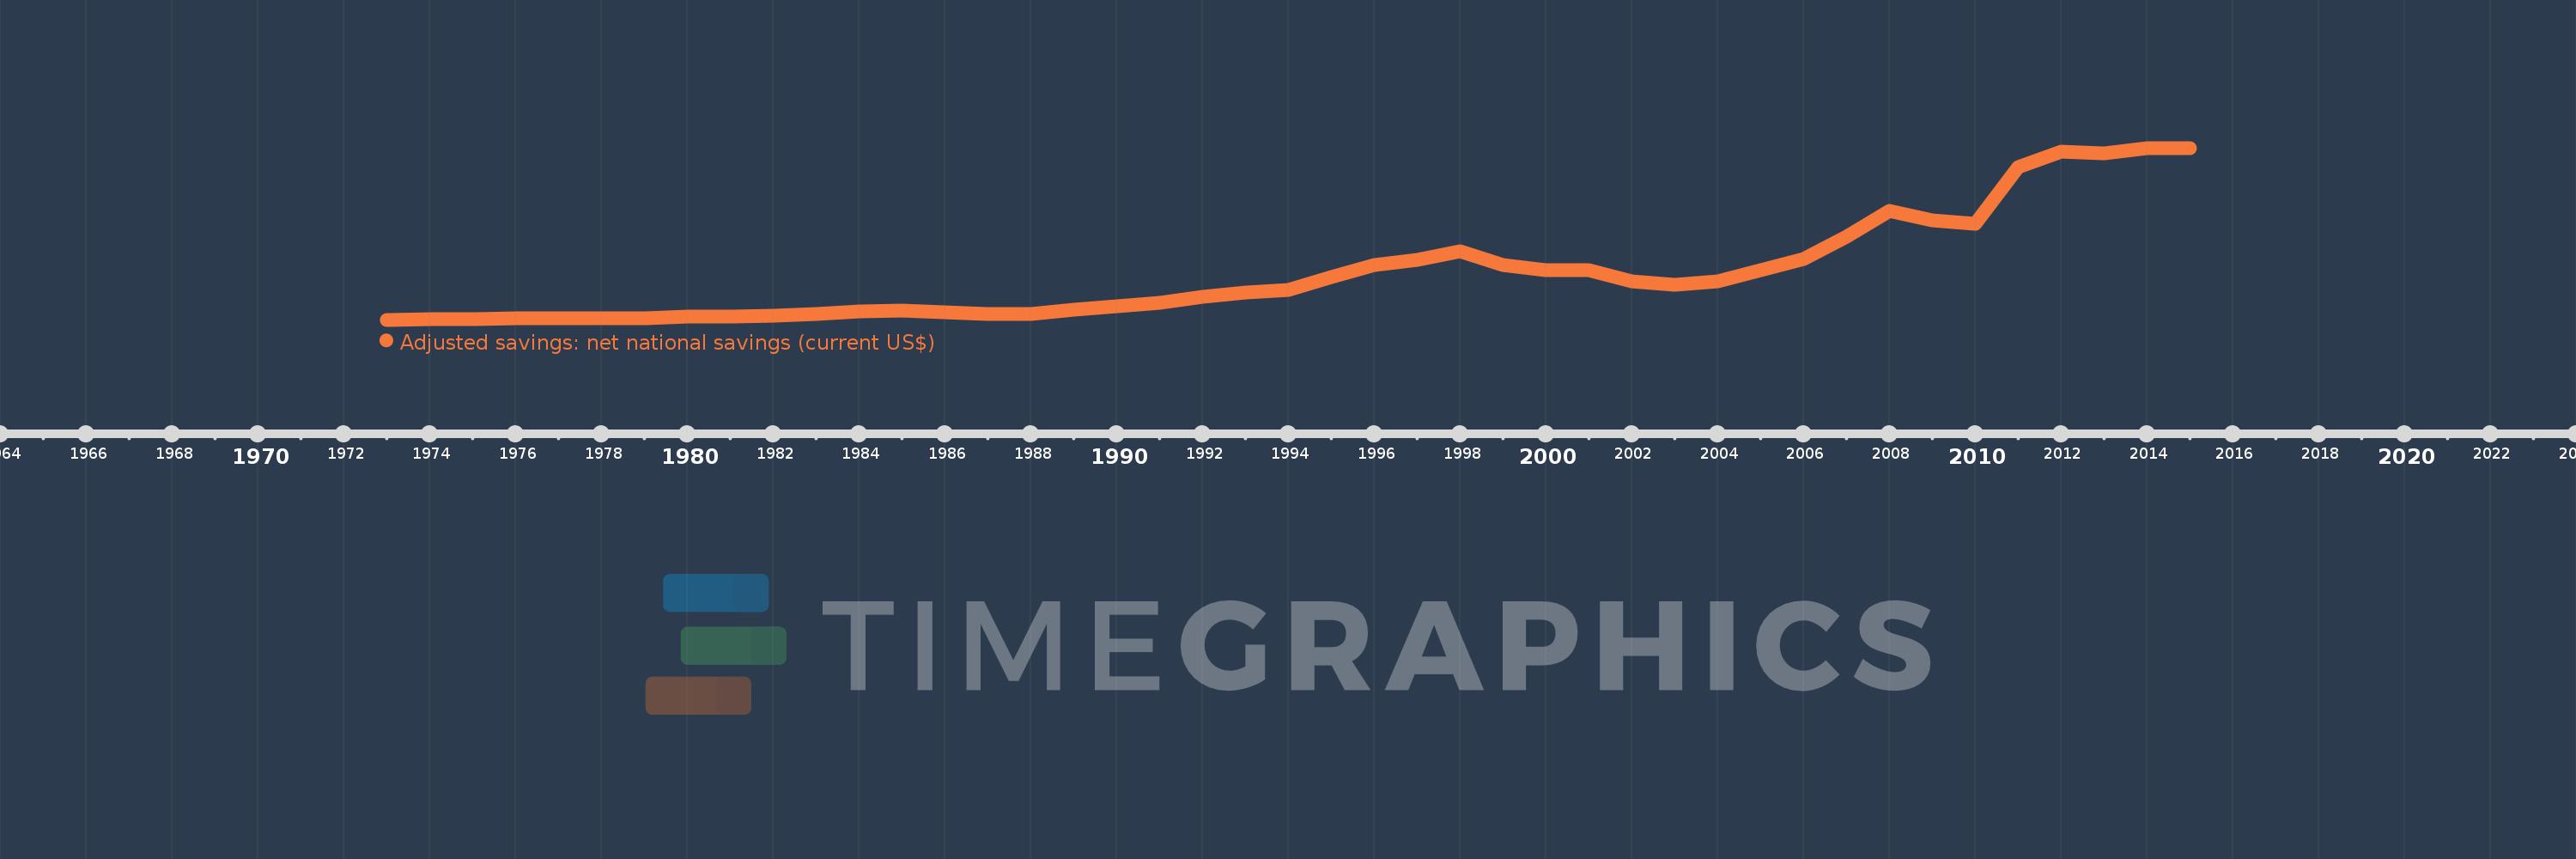
Adjusted savings: net national savings (current US$)
2015,2014,2013,2012,2011,2010,2009,2008,2007,2006,2005,2004,2003,2002,2001,2000,1999,1998,1997,1996,1995,1994,1993,1992,1991,1990,1989,1988,1987,1986,1985,1984,1983,1982,1981,1980,1979,1978,1977,1976,1975,1974,1973
This statistics in other country:
AfghanistanAlbaniaAlgeriaAngolaAntigua and BarbudaArgentinaArmeniaAustraliaAustriaAzerbaijanBahamas, TheBahrainBangladeshBarbadosBelarusBelgiumBelizeBeninBermudaBhutanBoliviaBosnia and HerzegovinaBotswanaBrazilBrunei DarussalamBulgariaBurkina FasoBurundiCabo VerdeCambodiaCameroonCanadaCentral African RepublicChadChileChinaColombiaComorosCongo, Dem. Rep.Congo, Rep.Costa RicaCote d'IvoireCroatiaCyprusCzech RepublicDenmarkDjiboutiDominicaDominican RepublicEcuadorEgypt, Arab Rep.El SalvadorEquatorial GuineaEritreaEstoniaEthiopiaFijiFinlandFranceGabonGambia, TheGeorgiaGermanyGhanaGreeceGrenadaGuatemalaGuineaGuinea-BissauGuyanaHaitiHondurasHong Kong SAR, ChinaHungaryIcelandIndiaIndonesiaIran, Islamic Rep.IraqIrelandIsraelItalyJamaicaJapanJordanKazakhstanKenyaKiribatiKorea, Rep.KosovoKuwaitKyrgyz RepublicLao PDRLatviaLebanonLesothoLiberiaLibyaLithuaniaLuxembourgMacao SAR, ChinaMacedonia, FYRMadagascarMalawiMalaysiaMaldivesMaliMaltaMauritaniaMauritiusMexicoMoldovaMongoliaMontenegroMoroccoMozambiqueNamibiaNepalNetherlandsNew ZealandNicaraguaNigerNigeriaNorwayOmanPakistanPanamaPapua New GuineaParaguayPeruPhilippinesPolandPortugalQatarRomaniaRussian FederationRwandaSaudi ArabiaSenegalSerbiaSeychellesSierra LeoneSingaporeSlovak RepublicSloveniaSolomon IslandsSouth AfricaSpainSri LankaSt. Kitts and NevisSt. LuciaSt. Vincent and the GrenadinesSudanSurinameSwazilandSwedenSwitzerlandSyrian Arab RepublicTajikistanTanzaniaThailandTimor-LesteTogoTongaTrinidad and TobagoTunisiaTurkeyTurkmenistanUgandaUkraineUnited KingdomUnited StatesUruguayVanuatuVenezuela, RBVietnamWest Bank and GazaYemen, Rep.ZambiaZimbabwe Timeline:
This timeline shows a graph from 1973 to 2015 of Singapore. No data until 1972. Number of actual observations by date: 43.
Source name:
World Development Indicators
Source organization:
World Bank staff estimates based on sources and methods in World Bank's "The Changing Wealth of Nations: Measuring Sustainable Development in the New Millennium" (2011).
Categories, topics:
Economy & Growth, Environment
Last updated:
apr 23, 2017
Indicators value changes by year
Minimum:
482.651 mln
jan 1, 1973
Maximum:
102.584 bln
jan 1, 2015
At the date of observation
Value
Absolute change
Change from previous value
jan 1, 1973
482.651 mln
+482.651 mln
0.0%
jan 1, 1974
733.681 mln
+251.03 mln
52.01%
jan 1, 1975
891.818 mln
+158.137 mln
21.55%
jan 1, 1976
1.102 bln
+210.151 mln
23.56%
jan 1, 1977
1.27 bln
+167.792 mln
15.23%
jan 1, 1978
1.326 bln
+56.328 mln
4.44%
jan 1, 1979
1.579 bln
+252.818 mln
19.06%
jan 1, 1980
2.175 bln
+596.589 mln
37.78%
jan 1, 1981
2.311 bln
+135.498 mln
6.23%
jan 1, 1982
3.037 bln
+725.596 mln
31.4%
jan 1, 1983
3.92 bln
+883.594 mln
29.1%
jan 1, 1984
5.183 bln
+1.263 bln
32.22%
jan 1, 1985
6.131 bln
+947.619 mln
18.28%
jan 1, 1986
4.914 bln
-1.217 bln
-19.86%
jan 1, 1987
4.01 bln
-903.565 mln
-18.39%
jan 1, 1988
4.109 bln
+98.814 mln
2.46%
jan 1, 1989
6.421 bln
+2.313 bln
56.28%
jan 1, 1990
8.739 bln
+2.317 bln
36.09%
jan 1, 1991
10.646 bln
+1.907 bln
21.82%
jan 1, 1992
13.937 bln
+3.291 bln
30.92%
jan 1, 1993
16.872 bln
+2.935 bln
21.06%
jan 1, 1994
18.171 bln
+1.299 bln
7.7%
jan 1, 1995
25.807 bln
+7.636 bln
42.02%
jan 1, 1996
33.148 bln
+7.341 bln
28.44%
jan 1, 1997
35.836 bln
+2.688 bln
8.11%
jan 1, 1998
41.15 bln
+5.314 bln
14.83%
jan 1, 1999
33.152 bln
-7.998 bln
-19.44%
jan 1, 2000
29.778 bln
-3.374 bln
-10.18%
jan 1, 2001
30.177 bln
+399.011 mln
1.34%
jan 1, 2002
23.122 bln
-7.054 bln
-23.38%
jan 1, 2003
21.274 bln
-1.849 bln
-8.0%
jan 1, 2004
23.381 bln
+2.107 bln
9.9%
jan 1, 2005
29.698 bln
+6.317 bln
27.02%
jan 1, 2006
36.788 bln
+7.09 bln
23.87%
jan 1, 2007
49.662 bln
+12.874 bln
35.0%
jan 1, 2008
65.186 bln
+15.524 bln
31.26%
jan 1, 2009
59.393 bln
-5.793 bln
-8.89%
jan 1, 2010
57.486 bln
-1.907 bln
-3.21%
jan 1, 2011
91.054 bln
+33.569 bln
58.39%
jan 1, 2012
100.518 bln
+9.464 bln
10.39%
jan 1, 2013
99.185 bln
-1.333 bln
-1.33%
jan 1, 2014
102.242 bln
+3.057 bln
3.08%
jan 1, 2015
102.584 bln
+341.689 mln
0.33%
Ranking of countries by current statistics by years


Comments: