29
/
en
AIzaSyAYiBZKx7MnpbEhh9jyipgxe19OcubqV5w
April 1, 2024
243313
Solomon Islands
SLB
true
2
1
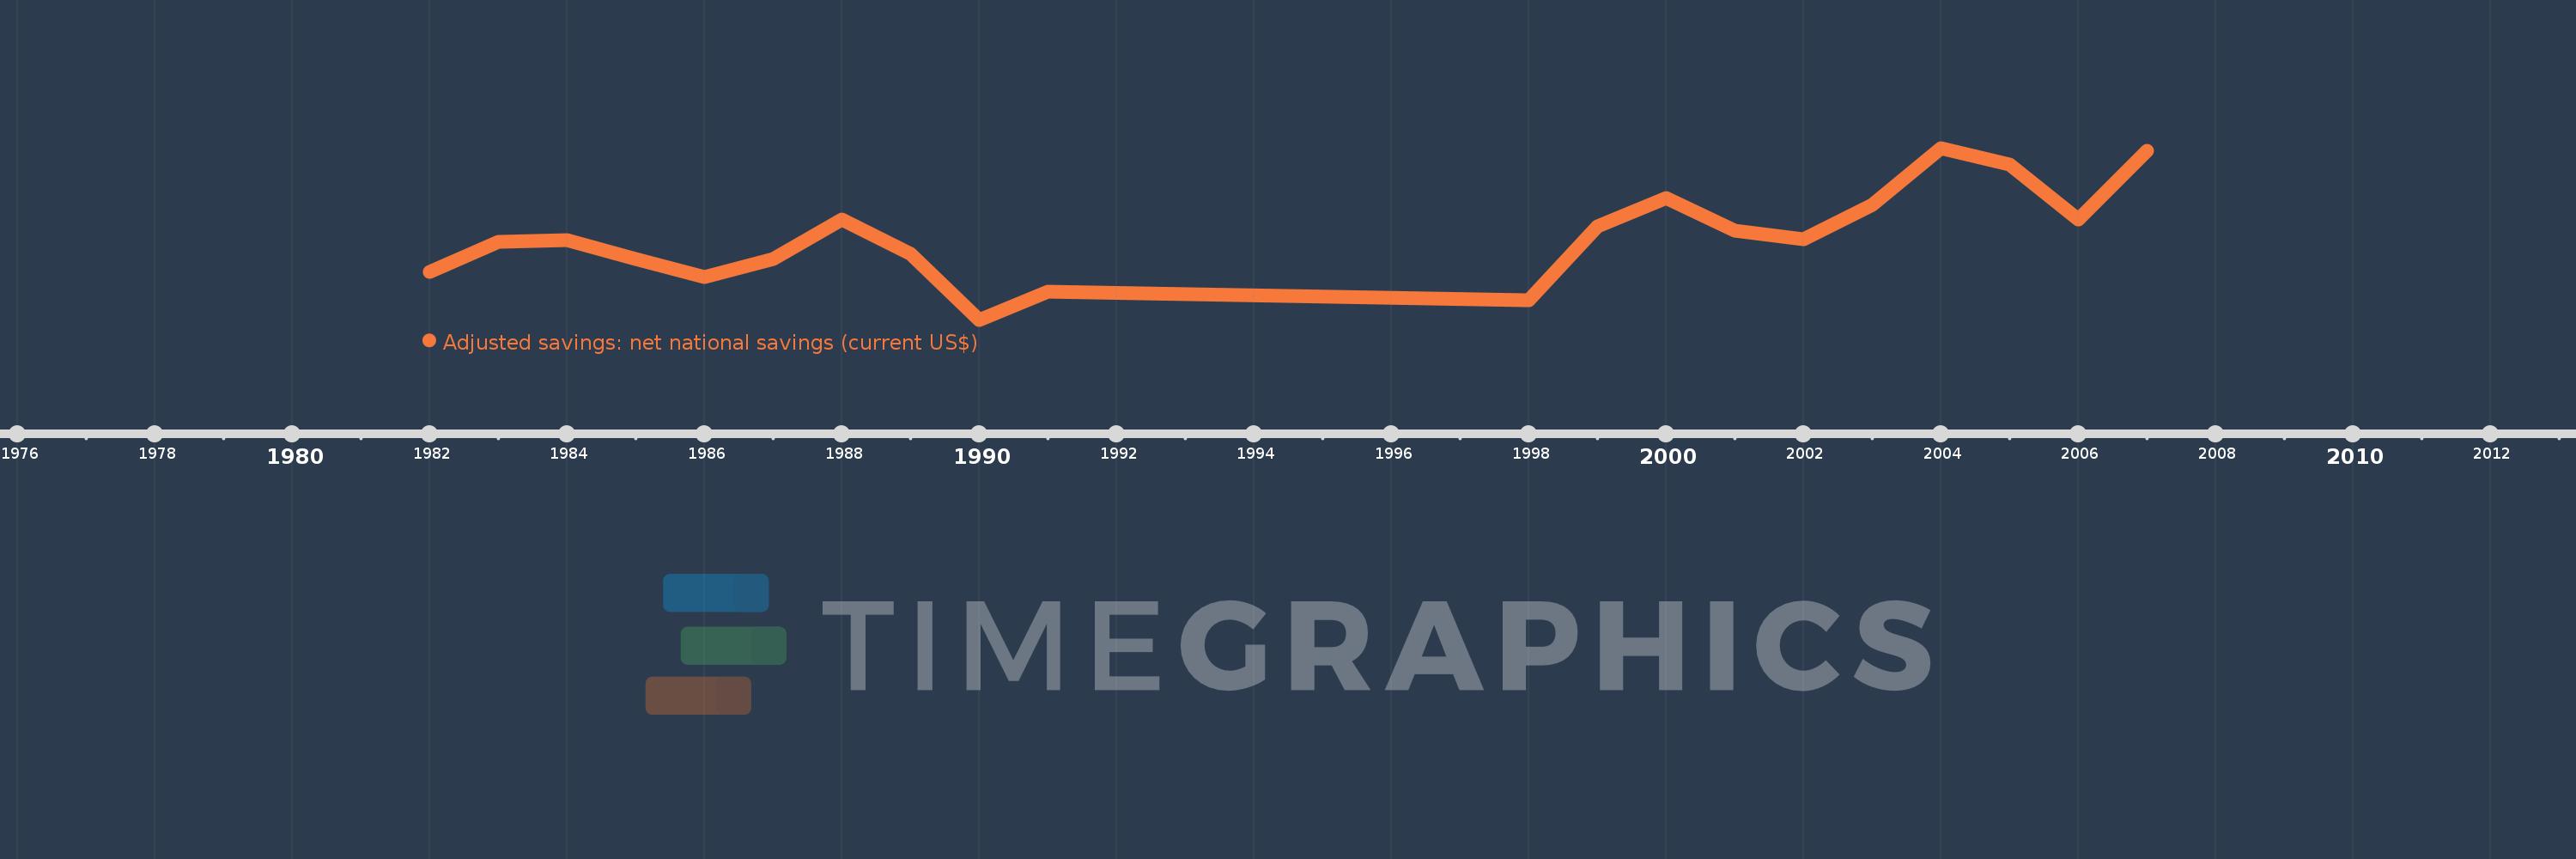
Adjusted savings: net national savings (current US$)
2007,2006,2005,2004,2003,2002,2001,2000,1999,1998,1991,1990,1989,1988,1987,1986,1985,1984,1983,1982
This statistics in other country:
AfghanistanAlbaniaAlgeriaAngolaAntigua and BarbudaArgentinaArmeniaAustraliaAustriaAzerbaijanBahamas, TheBahrainBangladeshBarbadosBelarusBelgiumBelizeBeninBermudaBhutanBoliviaBosnia and HerzegovinaBotswanaBrazilBrunei DarussalamBulgariaBurkina FasoBurundiCabo VerdeCambodiaCameroonCanadaCentral African RepublicChadChileChinaColombiaComorosCongo, Dem. Rep.Congo, Rep.Costa RicaCote d'IvoireCroatiaCyprusCzech RepublicDenmarkDjiboutiDominicaDominican RepublicEcuadorEgypt, Arab Rep.El SalvadorEquatorial GuineaEritreaEstoniaEthiopiaFijiFinlandFranceGabonGambia, TheGeorgiaGermanyGhanaGreeceGrenadaGuatemalaGuineaGuinea-BissauGuyanaHaitiHondurasHong Kong SAR, ChinaHungaryIcelandIndiaIndonesiaIran, Islamic Rep.IraqIrelandIsraelItalyJamaicaJapanJordanKazakhstanKenyaKiribatiKorea, Rep.KosovoKuwaitKyrgyz RepublicLao PDRLatviaLebanonLesothoLiberiaLibyaLithuaniaLuxembourgMacao SAR, ChinaMacedonia, FYRMadagascarMalawiMalaysiaMaldivesMaliMaltaMauritaniaMauritiusMexicoMoldovaMongoliaMontenegroMoroccoMozambiqueNamibiaNepalNetherlandsNew ZealandNicaraguaNigerNigeriaNorwayOmanPakistanPanamaPapua New GuineaParaguayPeruPhilippinesPolandPortugalQatarRomaniaRussian FederationRwandaSaudi ArabiaSenegalSerbiaSeychellesSierra LeoneSingaporeSlovak RepublicSloveniaSolomon IslandsSouth AfricaSpainSri LankaSt. Kitts and NevisSt. LuciaSt. Vincent and the GrenadinesSudanSurinameSwazilandSwedenSwitzerlandSyrian Arab RepublicTajikistanTanzaniaThailandTimor-LesteTogoTongaTrinidad and TobagoTunisiaTurkeyTurkmenistanUgandaUkraineUnited KingdomUnited StatesUruguayVanuatuVenezuela, RBVietnamWest Bank and GazaYemen, Rep.ZambiaZimbabwe Timeline:
This timeline shows a graph from 1982 to 2007 of Solomon Islands. No data until 1981. Number of actual observations by date: 20.
Source name:
World Development Indicators
Source organization:
World Bank staff estimates based on sources and methods in World Bank's "The Changing Wealth of Nations: Measuring Sustainable Development in the New Millennium" (2011).
Categories, topics:
Economy & Growth, Environment
Last updated:
apr 23, 2017
Indicators value changes by year
Minimum:
-148.225 mln
jan 1, 1990
Maximum:
13.242 mln
jan 1, 2004
At the date of observation
Value
Absolute change
Change from previous value
jan 1, 1982
-102.951 mln
-102.951 mln
0.0%
jan 1, 1983
-74.711 mln
+28.24 mln
-27.43%
jan 1, 1984
-73.655 mln
+1.056 mln
-1.41%
jan 1, 1985
-91.487 mln
-17.832 mln
24.21%
jan 1, 1986
-108.146 mln
-16.659 mln
18.21%
jan 1, 1987
-91.336 mln
+16.81 mln
-15.54%
jan 1, 1988
-54.365 mln
+36.97 mln
-40.48%
jan 1, 1989
-85.916 mln
-31.551 mln
58.03%
jan 1, 1990
-148.225 mln
-62.308 mln
72.52%
jan 1, 1991
-122.219 mln
+26.005 mln
-17.54%
jan 1, 1998
-130.14 mln
-7.921 mln
6.48%
jan 1, 1999
-60.399 mln
+69.741 mln
-53.59%
jan 1, 2000
-33.877 mln
+26.521 mln
-43.91%
jan 1, 2001
-64.184 mln
-30.307 mln
89.46%
jan 1, 2002
-72.953 mln
-8.769 mln
13.66%
jan 1, 2003
-39.944 mln
+33.009 mln
-45.25%
jan 1, 2004
13.242 mln
+53.186 mln
-133.15%
jan 1, 2005
-2.197 mln
-15.44 mln
-116.59%
jan 1, 2006
-53.99 mln
-51.792 mln
2.36K%
jan 1, 2007
10.86 mln
+64.849 mln
-120.11%
Ranking of countries by current statistics by years


Comments: