29
/
en
AIzaSyAYiBZKx7MnpbEhh9jyipgxe19OcubqV5w
April 1, 2024
284261
Yemen, Rep.
YEM
true
2
1
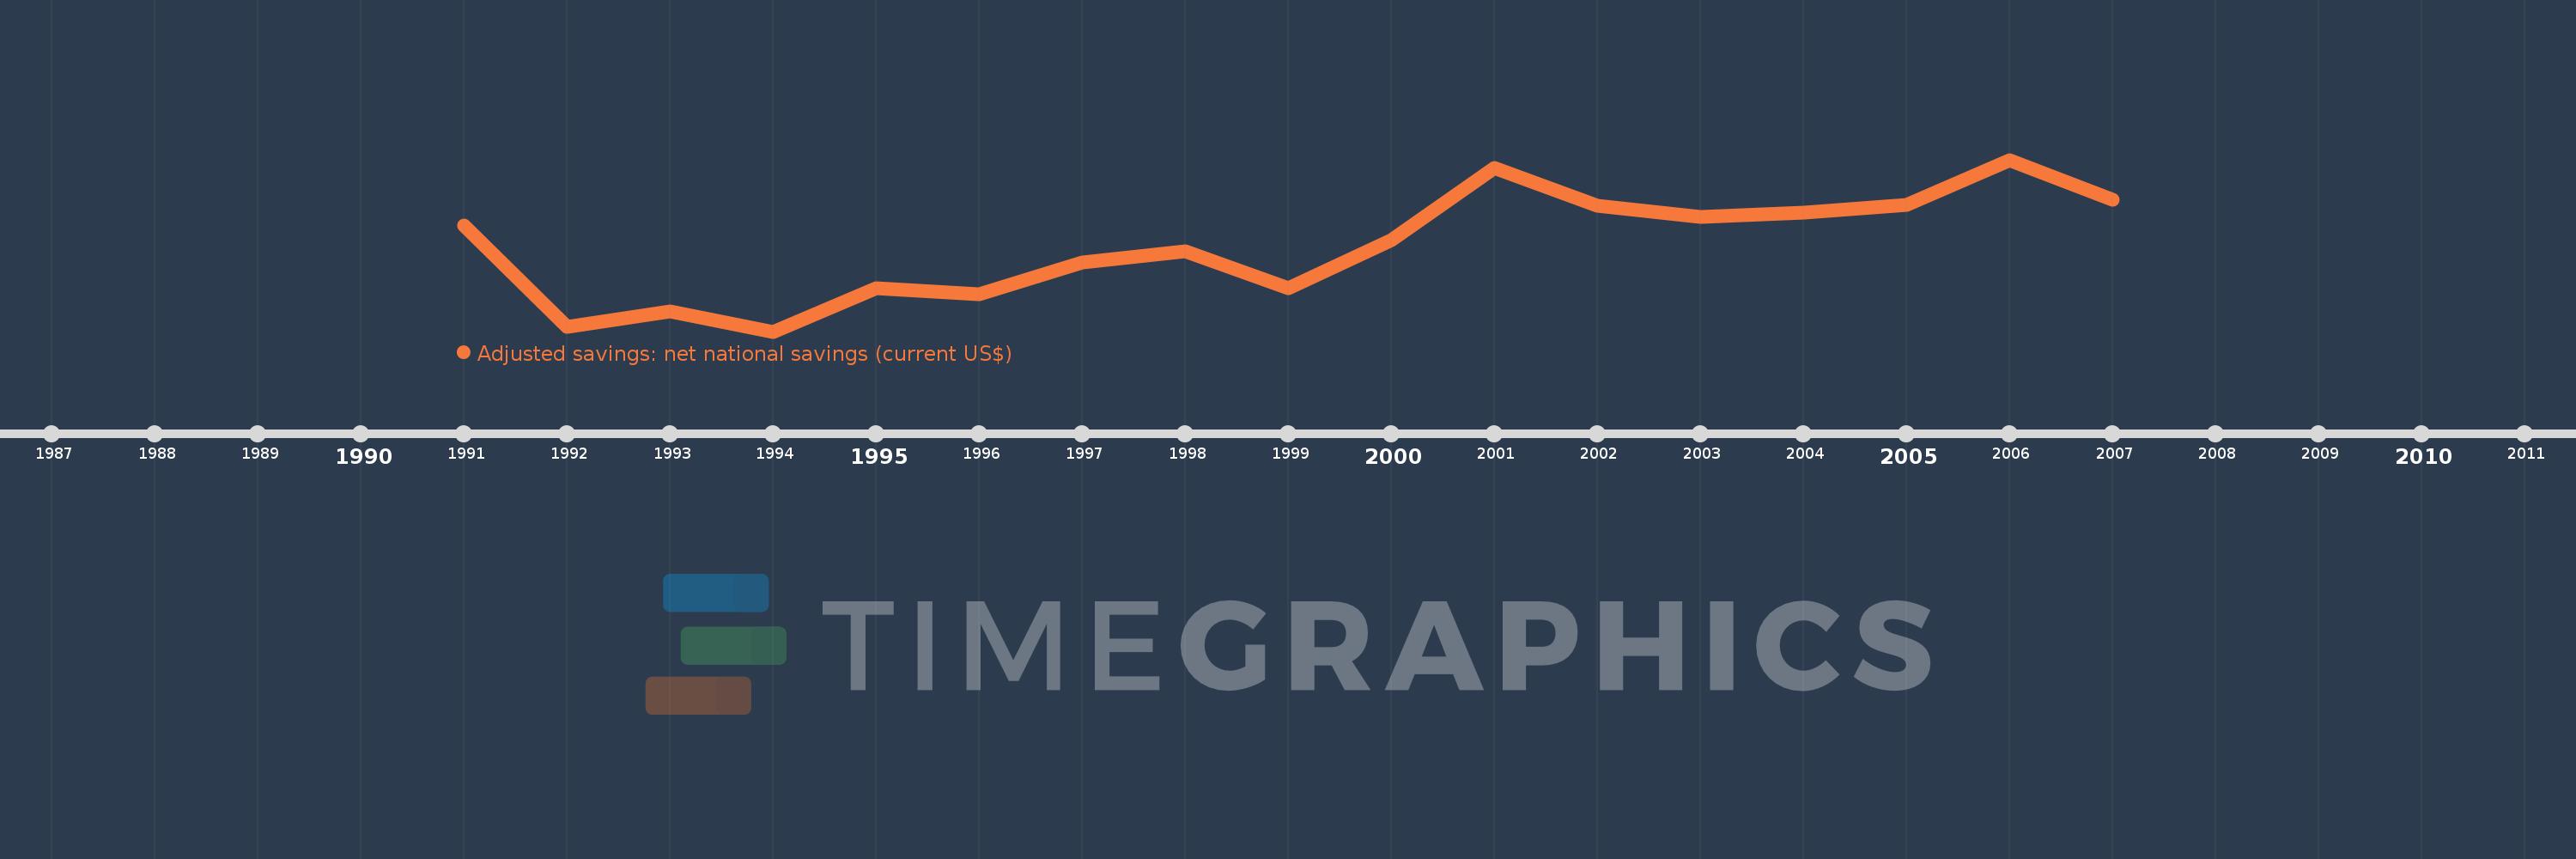
Adjusted savings: net national savings (current US$)
2007,2006,2005,2004,2003,2002,2001,2000,1999,1998,1997,1996,1995,1994,1993,1992,1991
This statistics in other country:
AfghanistanAlbaniaAlgeriaAngolaAntigua and BarbudaArgentinaArmeniaAustraliaAustriaAzerbaijanBahamas, TheBahrainBangladeshBarbadosBelarusBelgiumBelizeBeninBermudaBhutanBoliviaBosnia and HerzegovinaBotswanaBrazilBrunei DarussalamBulgariaBurkina FasoBurundiCabo VerdeCambodiaCameroonCanadaCentral African RepublicChadChileChinaColombiaComorosCongo, Dem. Rep.Congo, Rep.Costa RicaCote d'IvoireCroatiaCyprusCzech RepublicDenmarkDjiboutiDominicaDominican RepublicEcuadorEgypt, Arab Rep.El SalvadorEquatorial GuineaEritreaEstoniaEthiopiaFijiFinlandFranceGabonGambia, TheGeorgiaGermanyGhanaGreeceGrenadaGuatemalaGuineaGuinea-BissauGuyanaHaitiHondurasHong Kong SAR, ChinaHungaryIcelandIndiaIndonesiaIran, Islamic Rep.IraqIrelandIsraelItalyJamaicaJapanJordanKazakhstanKenyaKiribatiKorea, Rep.KosovoKuwaitKyrgyz RepublicLao PDRLatviaLebanonLesothoLiberiaLibyaLithuaniaLuxembourgMacao SAR, ChinaMacedonia, FYRMadagascarMalawiMalaysiaMaldivesMaliMaltaMauritaniaMauritiusMexicoMoldovaMongoliaMontenegroMoroccoMozambiqueNamibiaNepalNetherlandsNew ZealandNicaraguaNigerNigeriaNorwayOmanPakistanPanamaPapua New GuineaParaguayPeruPhilippinesPolandPortugalQatarRomaniaRussian FederationRwandaSaudi ArabiaSenegalSerbiaSeychellesSierra LeoneSingaporeSlovak RepublicSloveniaSolomon IslandsSouth AfricaSpainSri LankaSt. Kitts and NevisSt. LuciaSt. Vincent and the GrenadinesSudanSurinameSwazilandSwedenSwitzerlandSyrian Arab RepublicTajikistanTanzaniaThailandTimor-LesteTogoTongaTrinidad and TobagoTunisiaTurkeyTurkmenistanUgandaUkraineUnited KingdomUnited StatesUruguayVanuatuVenezuela, RBVietnamWest Bank and GazaYemen, Rep.ZambiaZimbabwe Timeline:
This timeline shows a graph from 1991 to 2007 of Yemen, Rep.. No data until 1990. Number of actual observations by date: 17.
Source name:
World Development Indicators
Source organization:
World Bank staff estimates based on sources and methods in World Bank's "The Changing Wealth of Nations: Measuring Sustainable Development in the New Millennium" (2011).
Categories, topics:
Economy & Growth, Environment
Last updated:
apr 23, 2017
Indicators value changes by year
Minimum:
226.149 mln
jan 1, 1994
Maximum:
2.769 bln
jan 1, 2006
At the date of observation
Value
Absolute change
Change from previous value
jan 1, 1991
1.798 bln
+1.798 bln
0.0%
jan 1, 1992
290.523 mln
-1.507 bln
-83.84%
jan 1, 1993
524.294 mln
+233.771 mln
80.47%
jan 1, 1994
226.149 mln
-298.145 mln
-56.87%
jan 1, 1995
869.009 mln
+642.86 mln
284.26%
jan 1, 1996
783.356 mln
-85.652 mln
-9.86%
jan 1, 1997
1.245 bln
+462.007 mln
58.98%
jan 1, 1998
1.417 bln
+171.811 mln
13.8%
jan 1, 1999
874.467 mln
-542.707 mln
-38.3%
jan 1, 2000
1.575 bln
+700.603 mln
80.12%
jan 1, 2001
2.651 bln
+1.076 bln
68.32%
jan 1, 2002
2.087 bln
-563.975 mln
-21.27%
jan 1, 2003
1.917 bln
-170.022 mln
-8.15%
jan 1, 2004
1.989 bln
+71.68 mln
3.74%
jan 1, 2005
2.096 bln
+107.55 mln
5.41%
jan 1, 2006
2.769 bln
+672.179 mln
32.06%
jan 1, 2007
2.176 bln
-592.532 mln
-21.4%
Ranking of countries by current statistics by years


Comments: