29
/
en
AIzaSyAYiBZKx7MnpbEhh9jyipgxe19OcubqV5w
April 1, 2024
248282
Sri Lanka
LKA
true
2
1
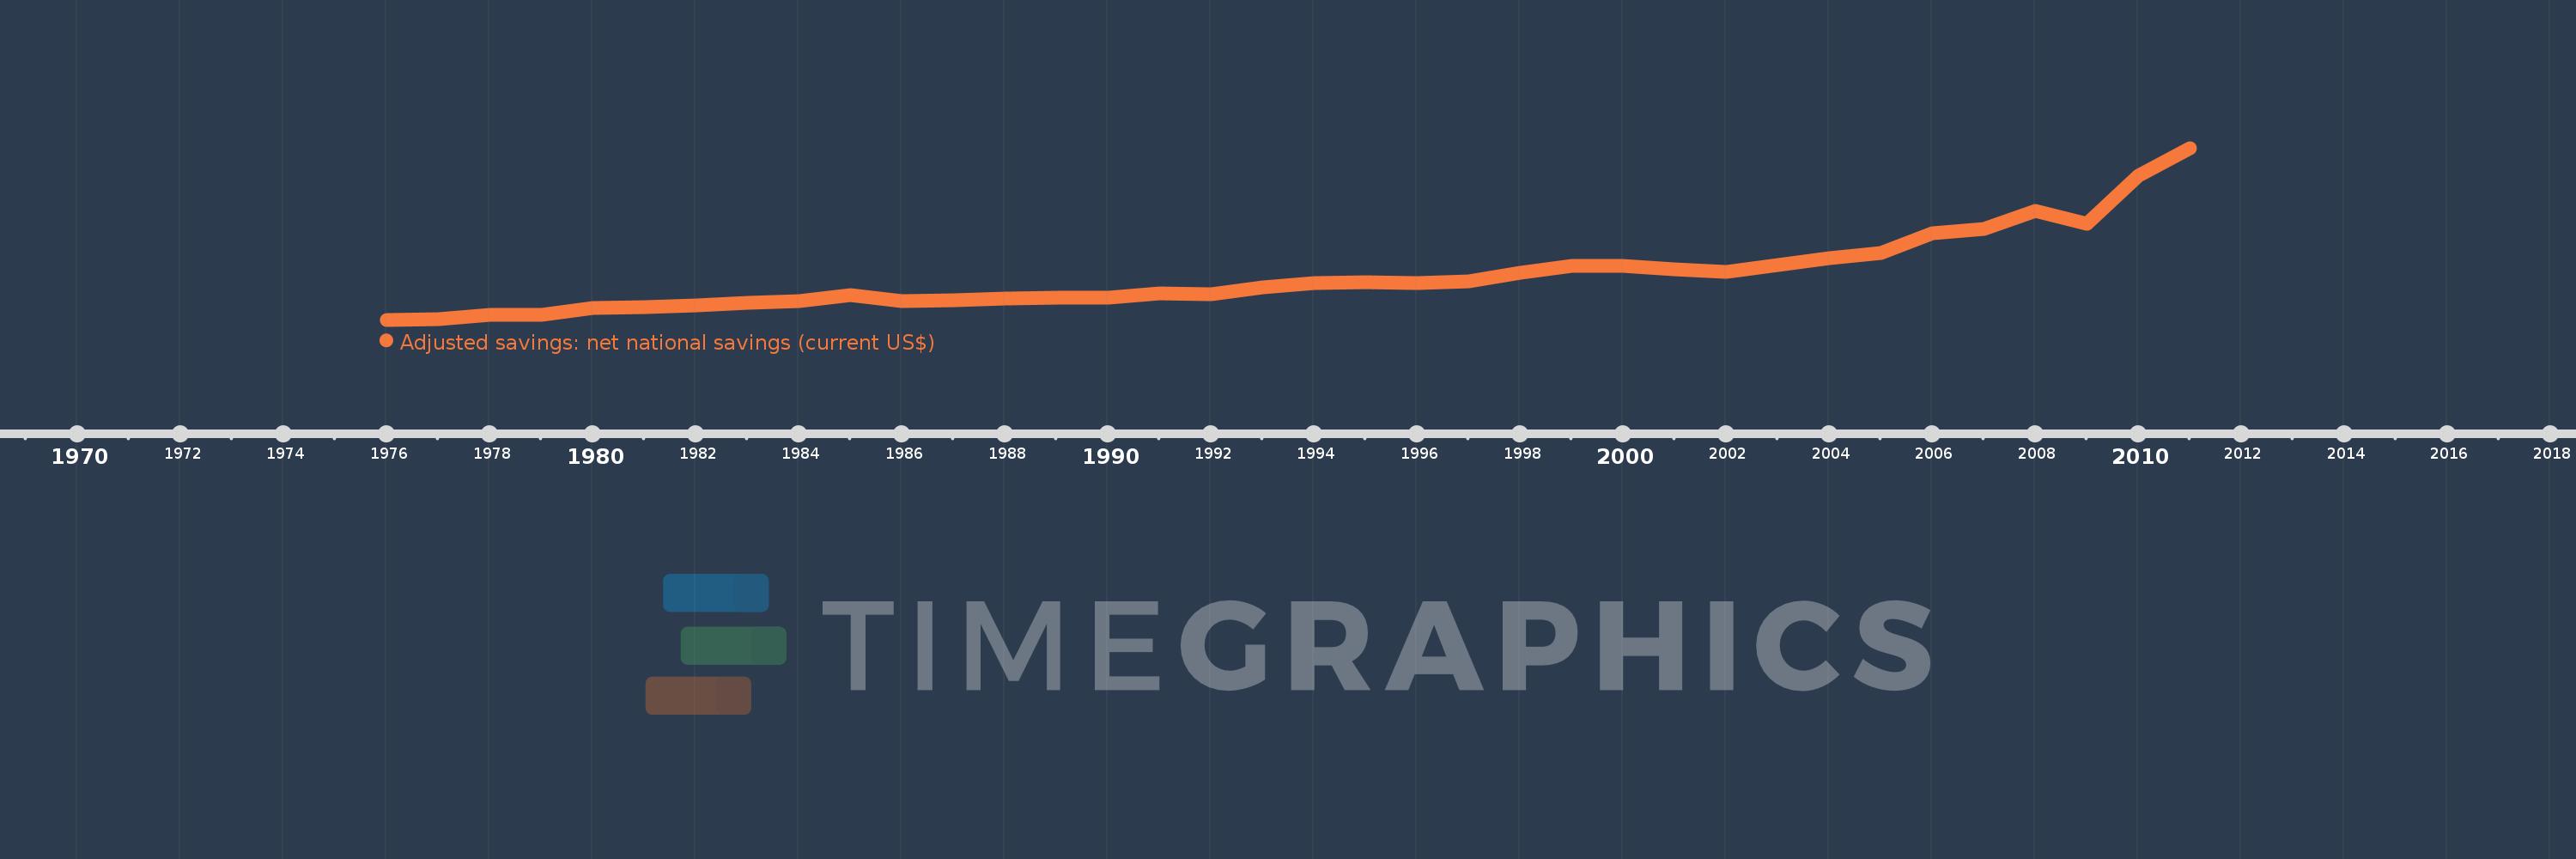
Adjusted savings: net national savings (current US$)
2011,2010,2009,2008,2007,2006,2005,2004,2003,2002,2001,2000,1999,1998,1997,1996,1995,1994,1993,1992,1991,1990,1989,1988,1987,1986,1985,1984,1983,1982,1981,1980,1979,1978,1977,1976
This statistics in other country:
AfghanistanAlbaniaAlgeriaAngolaAntigua and BarbudaArgentinaArmeniaAustraliaAustriaAzerbaijanBahamas, TheBahrainBangladeshBarbadosBelarusBelgiumBelizeBeninBermudaBhutanBoliviaBosnia and HerzegovinaBotswanaBrazilBrunei DarussalamBulgariaBurkina FasoBurundiCabo VerdeCambodiaCameroonCanadaCentral African RepublicChadChileChinaColombiaComorosCongo, Dem. Rep.Congo, Rep.Costa RicaCote d'IvoireCroatiaCyprusCzech RepublicDenmarkDjiboutiDominicaDominican RepublicEcuadorEgypt, Arab Rep.El SalvadorEquatorial GuineaEritreaEstoniaEthiopiaFijiFinlandFranceGabonGambia, TheGeorgiaGermanyGhanaGreeceGrenadaGuatemalaGuineaGuinea-BissauGuyanaHaitiHondurasHong Kong SAR, ChinaHungaryIcelandIndiaIndonesiaIran, Islamic Rep.IraqIrelandIsraelItalyJamaicaJapanJordanKazakhstanKenyaKiribatiKorea, Rep.KosovoKuwaitKyrgyz RepublicLao PDRLatviaLebanonLesothoLiberiaLibyaLithuaniaLuxembourgMacao SAR, ChinaMacedonia, FYRMadagascarMalawiMalaysiaMaldivesMaliMaltaMauritaniaMauritiusMexicoMoldovaMongoliaMontenegroMoroccoMozambiqueNamibiaNepalNetherlandsNew ZealandNicaraguaNigerNigeriaNorwayOmanPakistanPanamaPapua New GuineaParaguayPeruPhilippinesPolandPortugalQatarRomaniaRussian FederationRwandaSaudi ArabiaSenegalSerbiaSeychellesSierra LeoneSingaporeSlovak RepublicSloveniaSolomon IslandsSouth AfricaSpainSri LankaSt. Kitts and NevisSt. LuciaSt. Vincent and the GrenadinesSudanSurinameSwazilandSwedenSwitzerlandSyrian Arab RepublicTajikistanTanzaniaThailandTimor-LesteTogoTongaTrinidad and TobagoTunisiaTurkeyTurkmenistanUgandaUkraineUnited KingdomUnited StatesUruguayVanuatuVenezuela, RBVietnamWest Bank and GazaYemen, Rep.ZambiaZimbabwe Timeline:
This timeline shows a graph from 1976 to 2011 of Sri Lanka. No data until 1975. Number of actual observations by date: 36.
Source name:
World Development Indicators
Source organization:
World Bank staff estimates based on sources and methods in World Bank's "The Changing Wealth of Nations: Measuring Sustainable Development in the New Millennium" (2011).
Categories, topics:
Economy & Growth, Environment
Last updated:
apr 23, 2017
Indicators value changes by year
Minimum:
-196.638 mln
jan 1, 1976
Maximum:
9.655 bln
jan 1, 2011
At the date of observation
Value
Absolute change
Change from previous value
jan 1, 1976
-196.638 mln
-196.638 mln
0.0%
jan 1, 1977
-142.05 mln
+54.588 mln
-27.76%
jan 1, 1978
65.137 mln
+207.187 mln
-145.85%
jan 1, 1979
72.149 mln
+7.012 mln
10.77%
jan 1, 1980
477.324 mln
+405.175 mln
561.58%
jan 1, 1981
510.619 mln
+33.295 mln
6.98%
jan 1, 1982
611.565 mln
+100.946 mln
19.77%
jan 1, 1983
774.375 mln
+162.81 mln
26.62%
jan 1, 1984
863.907 mln
+89.532 mln
11.56%
jan 1, 1985
1.235 bln
+371.422 mln
42.99%
jan 1, 1986
850.813 mln
-384.516 mln
-31.13%
jan 1, 1987
938.331 mln
+87.518 mln
10.29%
jan 1, 1988
1.02 bln
+81.649 mln
8.7%
jan 1, 1989
1.052 bln
+32.348 mln
3.17%
jan 1, 1990
1.051 bln
-1.346 mln
-0.13%
jan 1, 1991
1.315 bln
+264.031 mln
25.12%
jan 1, 1992
1.277 bln
-38.478 mln
-2.93%
jan 1, 1993
1.648 bln
+371.561 mln
29.11%
jan 1, 1994
1.895 bln
+246.42 mln
14.95%
jan 1, 1995
1.932 bln
+37.078 mln
1.96%
jan 1, 1996
1.91 bln
-21.812 mln
-1.13%
jan 1, 1997
1.998 bln
+88.493 mln
4.63%
jan 1, 1998
2.519 bln
+520.563 mln
26.05%
jan 1, 1999
2.884 bln
+365.539 mln
14.51%
jan 1, 2000
2.895 bln
+10.809 mln
0.37%
jan 1, 2001
2.707 bln
-188.445 mln
-6.51%
jan 1, 2002
2.552 bln
-154.538 mln
-5.71%
jan 1, 2003
2.928 bln
+375.966 mln
14.73%
jan 1, 2004
3.332 bln
+404.174 mln
13.8%
jan 1, 2005
3.635 bln
+302.464 mln
9.08%
jan 1, 2006
4.756 bln
+1.121 bln
30.85%
jan 1, 2007
5.009 bln
+252.75 mln
5.31%
jan 1, 2008
6.044 bln
+1.035 bln
20.66%
jan 1, 2009
5.283 bln
-760.852 mln
-12.59%
jan 1, 2010
8.07 bln
+2.787 bln
52.75%
jan 1, 2011
9.655 bln
+1.585 bln
19.64%
Ranking of countries by current statistics by years


Comments: