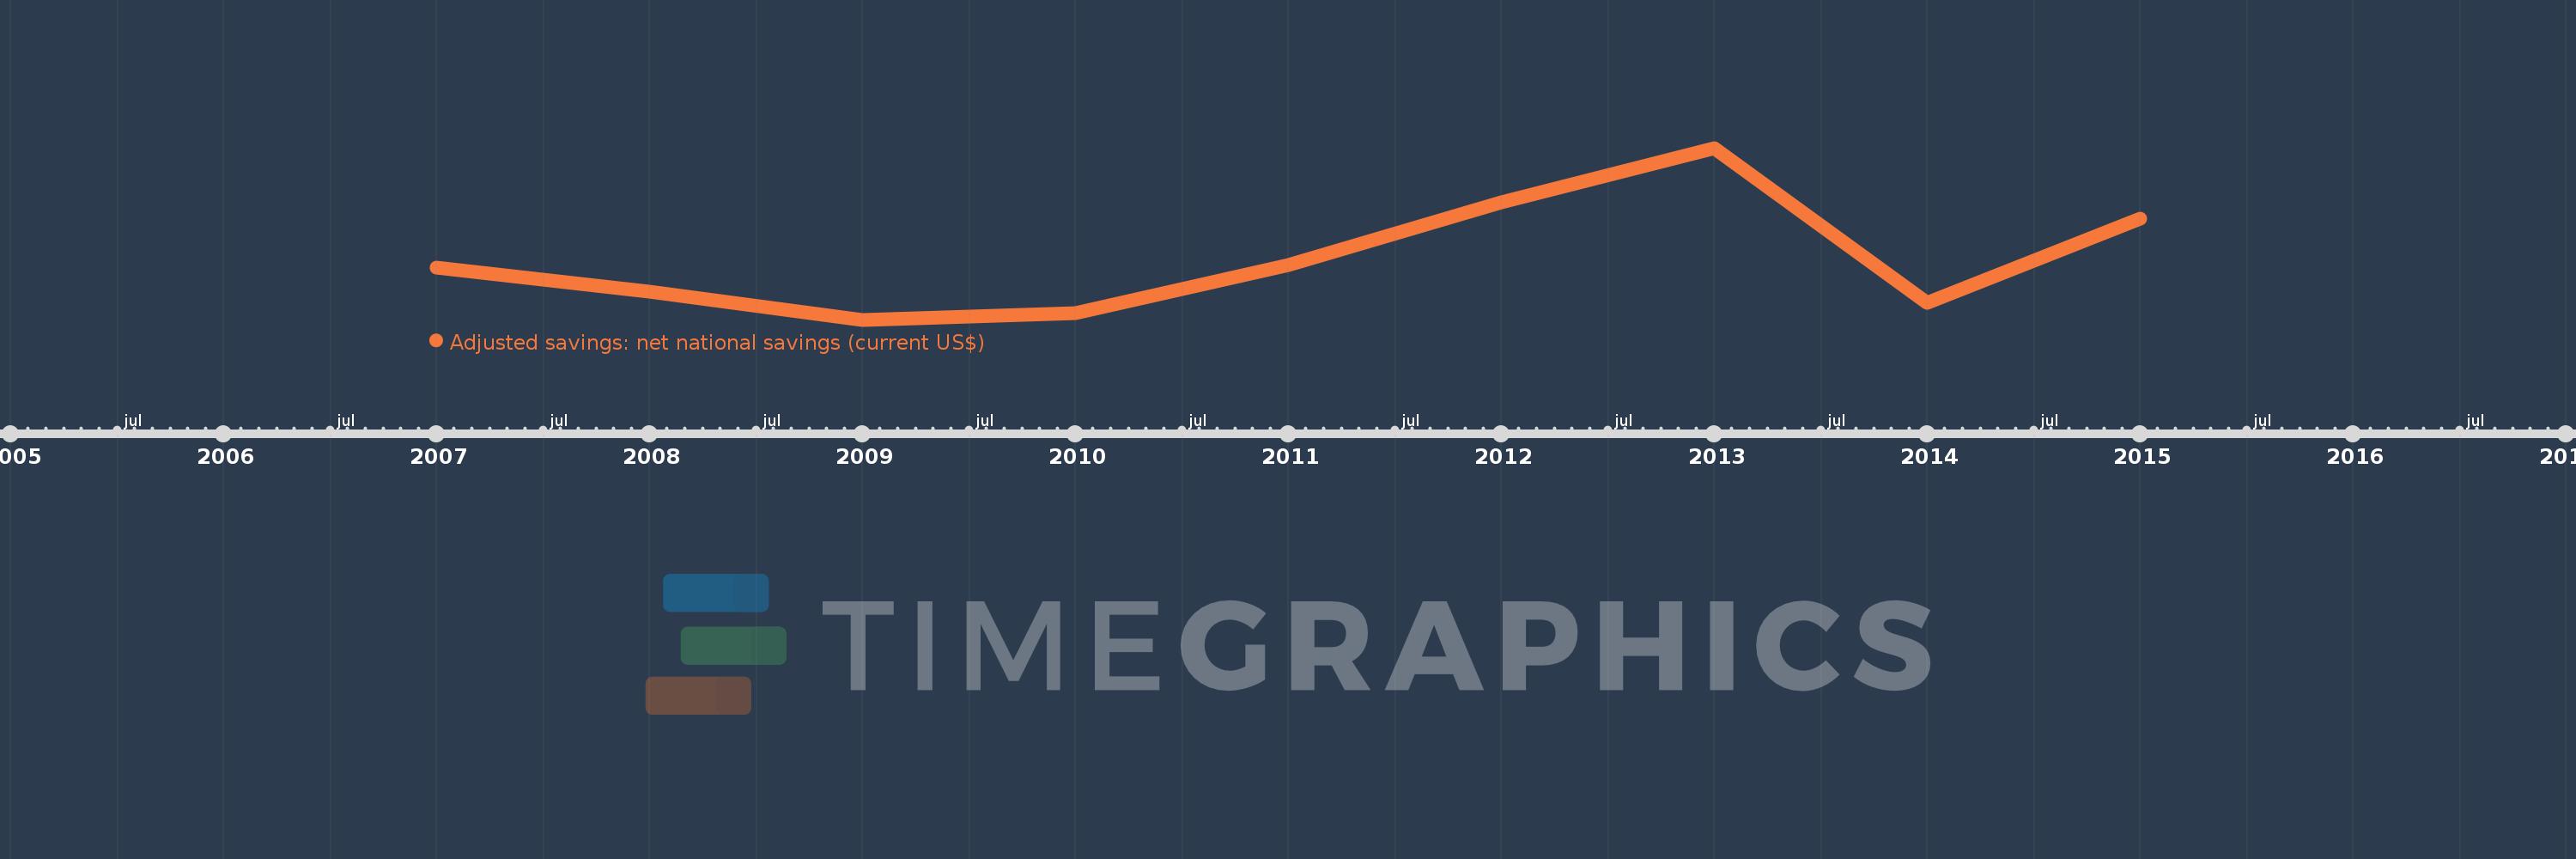
This timeline shows a graph from 2007 to 2015 of Bhutan. No data until 2006. Number of actual observations by date: 9.
Source name:
World Development Indicators
Source organization:
World Bank staff estimates based on sources and methods in World Bank's "The Changing Wealth of Nations: Measuring Sustainable Development in the New Millennium" (2011).
Categories, topics:
Economy & Growth, Environment
Last updated:
apr 23, 2017
Indicators value changes by year
Meaning:
428.215 mln
Minimum:
261.471 mln
jan 1, 2009
Maximum:
731.088 mln
jan 1, 2013
At the date of observation
Value
Absolute change
Change from the previous value
jan 1, 2007
404.879 mln
+404.879 mln
0.0%
jan 1, 2008
338.632 mln
-66.247 mln
-16.36%
jan 1, 2009
261.471 mln
-77.161 mln
-22.79%
jan 1, 2010
279.522 mln
+18.051 mln
6.9%
jan 1, 2011
411.082 mln
+131.56 mln
47.07%
jan 1, 2012
581.526 mln
+170.443 mln
41.46%
jan 1, 2013
731.088 mln
+149.562 mln
25.72%
jan 1, 2014
307.982 mln
-423.106 mln
-57.87%
jan 1, 2015
537.748 mln
+229.766 mln
74.6%
Ranking of countries by current statistics by years
