29
/
en
AIzaSyAYiBZKx7MnpbEhh9jyipgxe19OcubqV5w
April 1, 2024
65648
Algeria
DZA
true
2
1
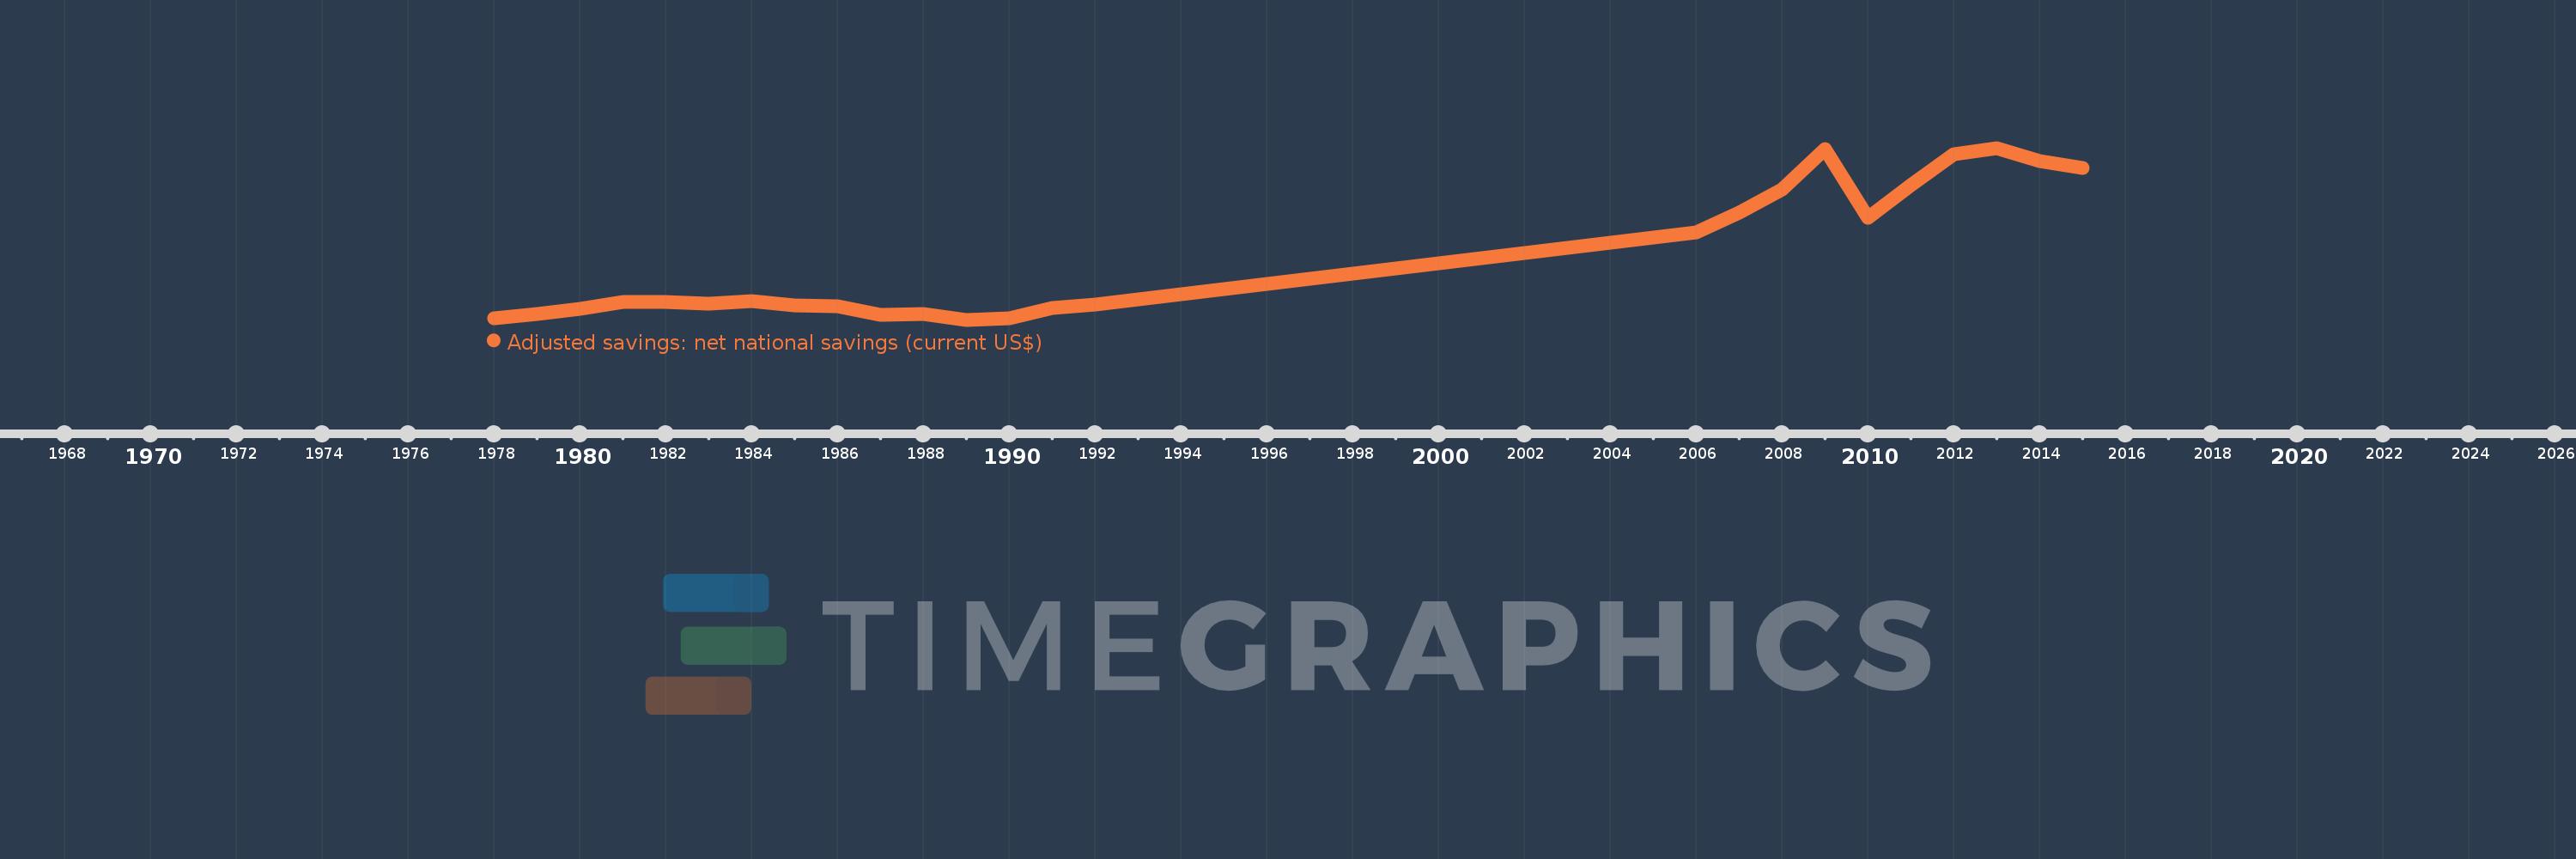
Adjusted savings: net national savings (current US$)
2015,2014,2013,2012,2011,2010,2009,2008,2007,2006,1992,1991,1990,1989,1988,1987,1986,1985,1984,1983,1982,1981,1980,1979,1978
This statistics in other country:
AfghanistanAlbaniaAlgeriaAngolaAntigua and BarbudaArgentinaArmeniaAustraliaAustriaAzerbaijanBahamas, TheBahrainBangladeshBarbadosBelarusBelgiumBelizeBeninBermudaBhutanBoliviaBosnia and HerzegovinaBotswanaBrazilBrunei DarussalamBulgariaBurkina FasoBurundiCabo VerdeCambodiaCameroonCanadaCentral African RepublicChadChileChinaColombiaComorosCongo, Dem. Rep.Congo, Rep.Costa RicaCote d'IvoireCroatiaCyprusCzech RepublicDenmarkDjiboutiDominicaDominican RepublicEcuadorEgypt, Arab Rep.El SalvadorEquatorial GuineaEritreaEstoniaEthiopiaFijiFinlandFranceGabonGambia, TheGeorgiaGermanyGhanaGreeceGrenadaGuatemalaGuineaGuinea-BissauGuyanaHaitiHondurasHong Kong SAR, ChinaHungaryIcelandIndiaIndonesiaIran, Islamic Rep.IraqIrelandIsraelItalyJamaicaJapanJordanKazakhstanKenyaKiribatiKorea, Rep.KosovoKuwaitKyrgyz RepublicLao PDRLatviaLebanonLesothoLiberiaLibyaLithuaniaLuxembourgMacao SAR, ChinaMacedonia, FYRMadagascarMalawiMalaysiaMaldivesMaliMaltaMauritaniaMauritiusMexicoMoldovaMongoliaMontenegroMoroccoMozambiqueNamibiaNepalNetherlandsNew ZealandNicaraguaNigerNigeriaNorwayOmanPakistanPanamaPapua New GuineaParaguayPeruPhilippinesPolandPortugalQatarRomaniaRussian FederationRwandaSaudi ArabiaSenegalSerbiaSeychellesSierra LeoneSingaporeSlovak RepublicSloveniaSolomon IslandsSouth AfricaSpainSri LankaSt. Kitts and NevisSt. LuciaSt. Vincent and the GrenadinesSudanSurinameSwazilandSwedenSwitzerlandSyrian Arab RepublicTajikistanTanzaniaThailandTimor-LesteTogoTongaTrinidad and TobagoTunisiaTurkeyTurkmenistanUgandaUkraineUnited KingdomUnited StatesUruguayVanuatuVenezuela, RBVietnamWest Bank and GazaYemen, Rep.ZambiaZimbabwe Timeline:
This timeline shows a graph from 1978 to 2015 of Algeria. No data until 1977. Number of actual observations by date: 25.
Source name:
World Development Indicators
Source organization:
World Bank staff estimates based on sources and methods in World Bank's "The Changing Wealth of Nations: Measuring Sustainable Development in the New Millennium" (2011).
Categories, topics:
Economy & Growth, Environment
Last updated:
apr 23, 2017
Indicators value changes by year
Minimum:
5.041 bln
jan 1, 1989
Maximum:
88.82 bln
jan 1, 2013
At the date of observation
Value
Absolute change
Change from previous value
jan 1, 1978
5.673 bln
+5.673 bln
0.0%
jan 1, 1979
7.68 bln
+2.007 bln
35.38%
jan 1, 1980
10.157 bln
+2.477 bln
32.25%
jan 1, 1981
13.903 bln
+3.746 bln
36.88%
jan 1, 1982
13.71 bln
-193.011 mln
-1.39%
jan 1, 1983
12.916 bln
-793.688 mln
-5.79%
jan 1, 1984
14.04 bln
+1.124 bln
8.7%
jan 1, 1985
12.09 bln
-1.95 bln
-13.89%
jan 1, 1986
11.57 bln
-519.438 mln
-4.3%
jan 1, 1987
7.52 bln
-4.051 bln
-35.01%
jan 1, 1988
7.863 bln
+342.89 mln
4.56%
jan 1, 1989
5.041 bln
-2.822 bln
-35.89%
jan 1, 1990
5.761 bln
+720.411 mln
14.29%
jan 1, 1991
10.773 bln
+5.011 bln
86.98%
jan 1, 1992
12.266 bln
+1.493 bln
13.86%
jan 1, 2006
47.659 bln
+35.393 bln
288.54%
jan 1, 2007
57.138 bln
+9.478 bln
19.89%
jan 1, 2008
68.509 bln
+11.372 bln
19.9%
jan 1, 2009
88.145 bln
+19.636 bln
28.66%
jan 1, 2010
54.944 bln
-33.202 bln
-37.67%
jan 1, 2011
70.568 bln
+15.625 bln
28.44%
jan 1, 2012
85.96 bln
+15.392 bln
21.81%
jan 1, 2013
88.82 bln
+2.859 bln
3.33%
jan 1, 2014
82.607 bln
-6.213 bln
-7.0%
jan 1, 2015
79.14 bln
-3.466 bln
-4.2%
Ranking of countries by current statistics by years


Comments: