29
/
en
AIzaSyAYiBZKx7MnpbEhh9jyipgxe19OcubqV5w
April 1, 2024
164438
Jordan
JOR
true
2
1
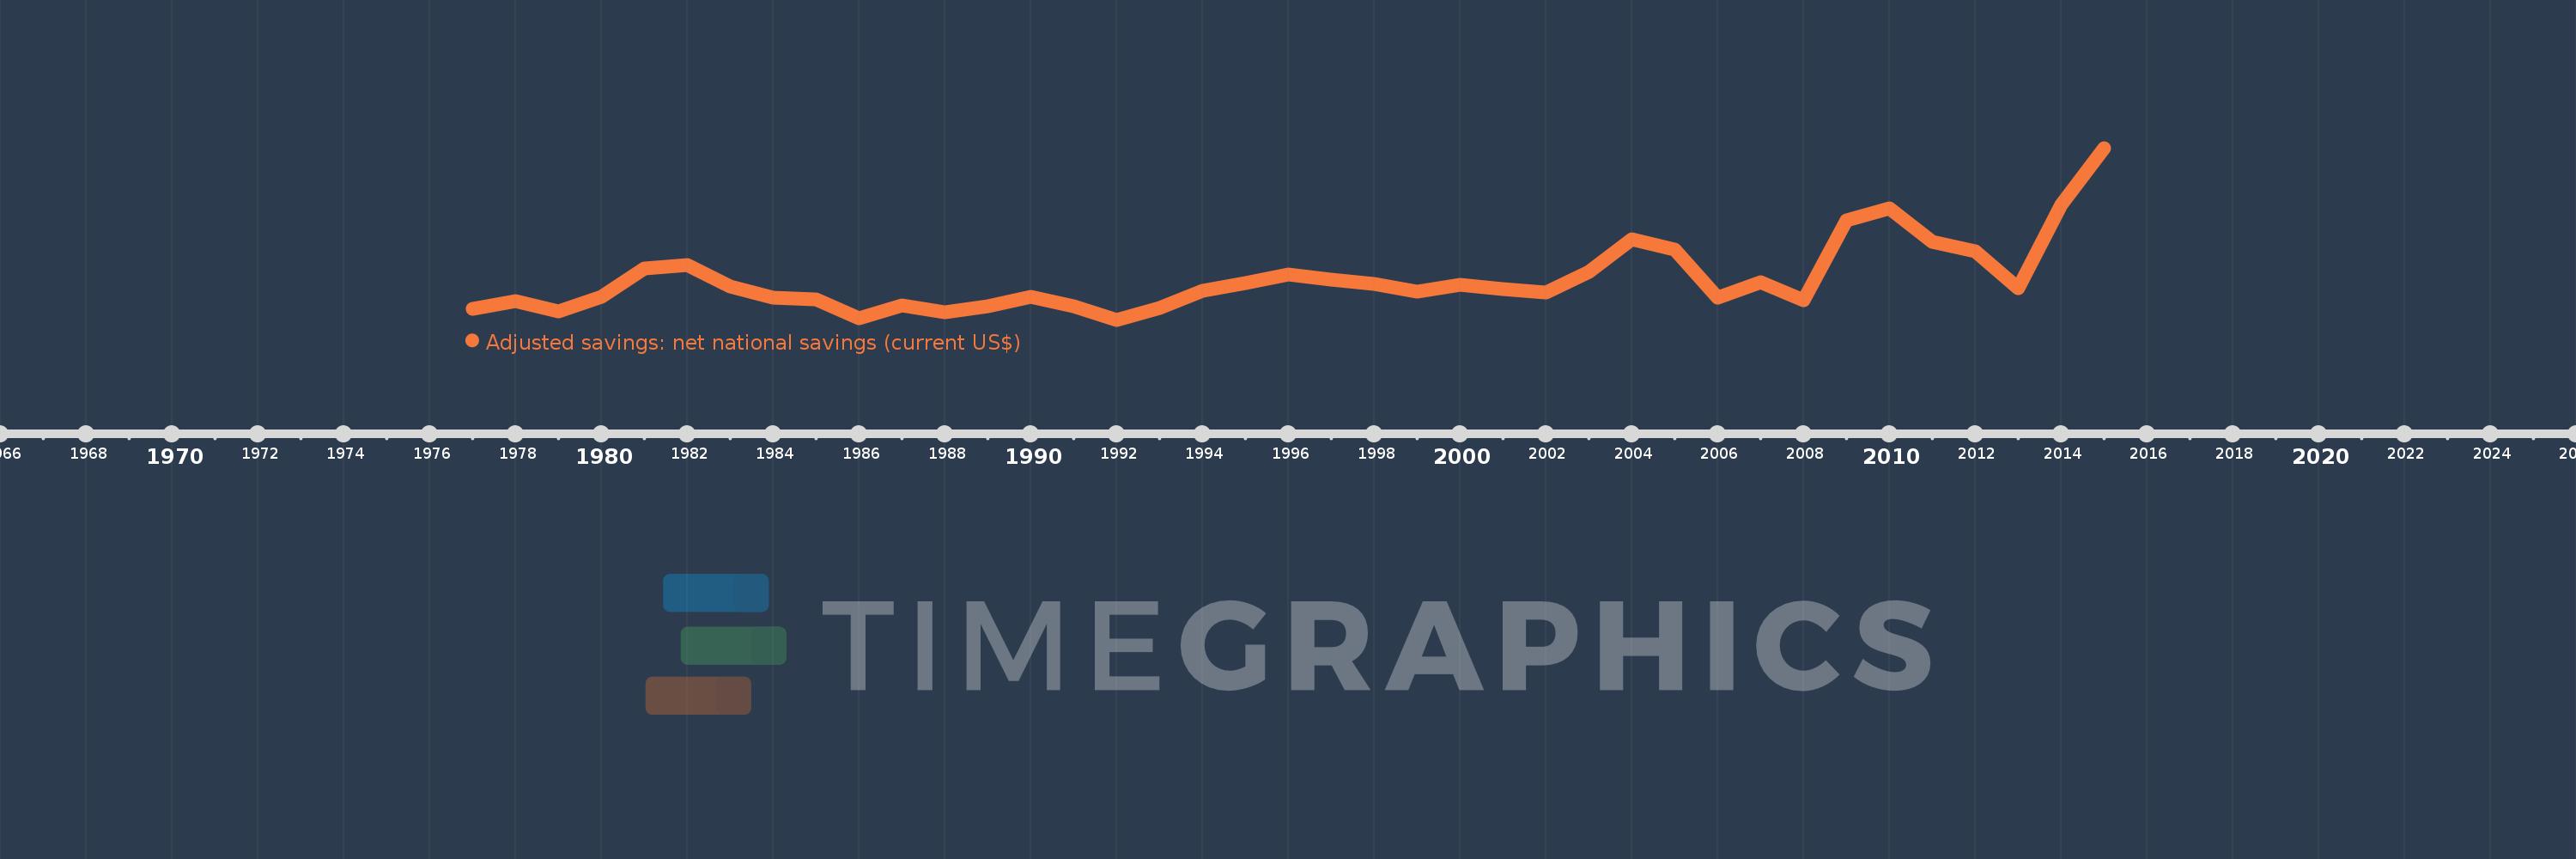
Adjusted savings: net national savings (current US$)
2015,2014,2013,2012,2011,2010,2009,2008,2007,2006,2005,2004,2003,2002,2001,2000,1999,1998,1997,1996,1995,1994,1993,1992,1991,1990,1989,1988,1987,1986,1985,1984,1983,1982,1981,1980,1979,1978,1977
This statistics in other country:
AfghanistanAlbaniaAlgeriaAngolaAntigua and BarbudaArgentinaArmeniaAustraliaAustriaAzerbaijanBahamas, TheBahrainBangladeshBarbadosBelarusBelgiumBelizeBeninBermudaBhutanBoliviaBosnia and HerzegovinaBotswanaBrazilBrunei DarussalamBulgariaBurkina FasoBurundiCabo VerdeCambodiaCameroonCanadaCentral African RepublicChadChileChinaColombiaComorosCongo, Dem. Rep.Congo, Rep.Costa RicaCote d'IvoireCroatiaCyprusCzech RepublicDenmarkDjiboutiDominicaDominican RepublicEcuadorEgypt, Arab Rep.El SalvadorEquatorial GuineaEritreaEstoniaEthiopiaFijiFinlandFranceGabonGambia, TheGeorgiaGermanyGhanaGreeceGrenadaGuatemalaGuineaGuinea-BissauGuyanaHaitiHondurasHong Kong SAR, ChinaHungaryIcelandIndiaIndonesiaIran, Islamic Rep.IraqIrelandIsraelItalyJamaicaJapanJordanKazakhstanKenyaKiribatiKorea, Rep.KosovoKuwaitKyrgyz RepublicLao PDRLatviaLebanonLesothoLiberiaLibyaLithuaniaLuxembourgMacao SAR, ChinaMacedonia, FYRMadagascarMalawiMalaysiaMaldivesMaliMaltaMauritaniaMauritiusMexicoMoldovaMongoliaMontenegroMoroccoMozambiqueNamibiaNepalNetherlandsNew ZealandNicaraguaNigerNigeriaNorwayOmanPakistanPanamaPapua New GuineaParaguayPeruPhilippinesPolandPortugalQatarRomaniaRussian FederationRwandaSaudi ArabiaSenegalSerbiaSeychellesSierra LeoneSingaporeSlovak RepublicSloveniaSolomon IslandsSouth AfricaSpainSri LankaSt. Kitts and NevisSt. LuciaSt. Vincent and the GrenadinesSudanSurinameSwazilandSwedenSwitzerlandSyrian Arab RepublicTajikistanTanzaniaThailandTimor-LesteTogoTongaTrinidad and TobagoTunisiaTurkeyTurkmenistanUgandaUkraineUnited KingdomUnited StatesUruguayVanuatuVenezuela, RBVietnamWest Bank and GazaYemen, Rep.ZambiaZimbabwe Timeline:
This timeline shows a graph from 1977 to 2015 of Jordan. No data until 1976. Number of actual observations by date: 39.
Source name:
World Development Indicators
Source organization:
World Bank staff estimates based on sources and methods in World Bank's "The Changing Wealth of Nations: Measuring Sustainable Development in the New Millennium" (2011).
Categories, topics:
Economy & Growth, Environment
Last updated:
apr 23, 2017
Indicators value changes by year
Minimum:
168.679 mln
jan 1, 1992
Maximum:
4.6 bln
jan 1, 2015
At the date of observation
Value
Absolute change
Change from previous value
jan 1, 1977
461.017 mln
+461.017 mln
0.0%
jan 1, 1978
656.172 mln
+195.155 mln
42.33%
jan 1, 1979
372.911 mln
-283.262 mln
-43.17%
jan 1, 1980
770.41 mln
+397.5 mln
106.59%
jan 1, 1981
1.484 bln
+713.276 mln
92.58%
jan 1, 1982
1.589 bln
+105.006 mln
7.08%
jan 1, 1983
1.025 bln
-563.668 mln
-35.48%
jan 1, 1984
737.939 mln
-287.085 mln
-28.01%
jan 1, 1985
699.766 mln
-38.173 mln
-5.17%
jan 1, 1986
210.369 mln
-489.397 mln
-69.94%
jan 1, 1987
539.308 mln
+328.938 mln
156.36%
jan 1, 1988
358.106 mln
-181.202 mln
-33.6%
jan 1, 1989
522.146 mln
+164.041 mln
45.81%
jan 1, 1990
766.41 mln
+244.264 mln
46.78%
jan 1, 1991
508.354 mln
-258.056 mln
-33.67%
jan 1, 1992
168.679 mln
-339.675 mln
-66.82%
jan 1, 1993
466.146 mln
+297.467 mln
176.35%
jan 1, 1994
916.891 mln
+450.745 mln
96.7%
jan 1, 1995
1.12 bln
+202.811 mln
22.12%
jan 1, 1996
1.343 bln
+223.521 mln
19.96%
jan 1, 1997
1.193 bln
-150.679 mln
-11.22%
jan 1, 1998
1.097 bln
-95.067 mln
-7.97%
jan 1, 1999
890.183 mln
-207.294 mln
-18.89%
jan 1, 2000
1.067 bln
+177.264 mln
19.91%
jan 1, 2001
967.373 mln
-100.074 mln
-9.38%
jan 1, 2002
875.288 mln
-92.085 mln
-9.52%
jan 1, 2003
1.399 bln
+523.281 mln
59.78%
jan 1, 2004
2.24 bln
+841.244 mln
60.15%
jan 1, 2005
1.983 bln
-256.36 mln
-11.45%
jan 1, 2006
732.172 mln
-1.251 bln
-63.09%
jan 1, 2007
1.134 bln
+401.384 mln
54.82%
jan 1, 2008
671.437 mln
-462.119 mln
-40.77%
jan 1, 2009
2.733 bln
+2.061 bln
306.97%
jan 1, 2010
3.04 bln
+307.637 mln
11.26%
jan 1, 2011
2.182 bln
-857.797 mln
-28.22%
jan 1, 2012
1.934 bln
-248.782 mln
-11.4%
jan 1, 2013
979.773 mln
-953.863 mln
-49.33%
jan 1, 2014
3.137 bln
+2.158 bln
220.21%
jan 1, 2015
4.6 bln
+1.463 bln
46.63%
Ranking of countries by current statistics by years


Comments: