29
/
en
AIzaSyAYiBZKx7MnpbEhh9jyipgxe19OcubqV5w
April 1, 2024
79895
Barbados
BRB
true
2
1
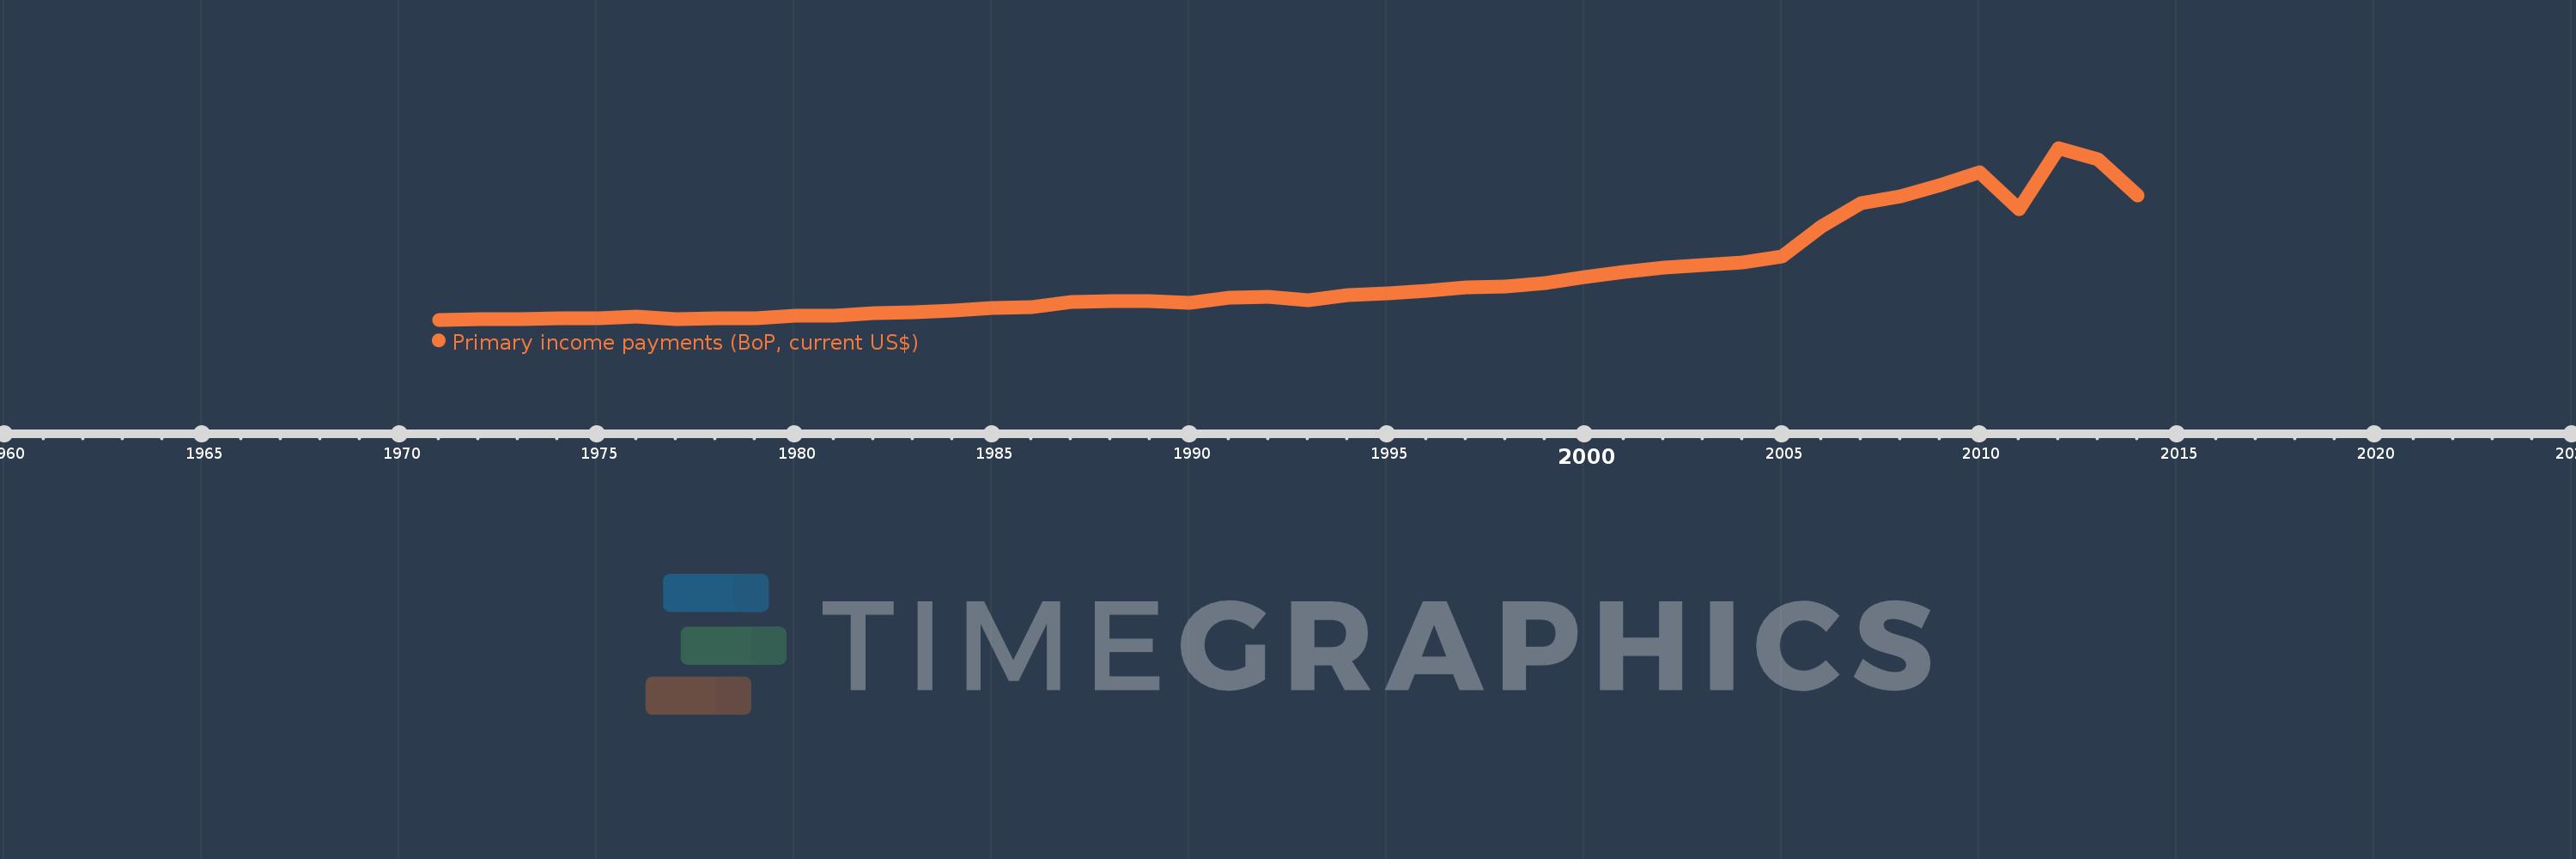
Primary income payments (BoP, current US$)
2014,2013,2012,2011,2010,2009,2008,2007,2006,2005,2004,2003,2002,2001,2000,1999,1998,1997,1996,1995,1994,1993,1992,1991,1990,1989,1988,1987,1986,1985,1984,1983,1982,1981,1980,1979,1978,1977,1976,1975,1974,1973,1972,1971
This statistics in other country:
AfghanistanAlbaniaAlgeriaAngolaAntigua and BarbudaArab WorldArgentinaArmeniaArubaAustraliaAustriaAzerbaijanBahamas, TheBahrainBangladeshBarbadosBelarusBelgiumBelizeBeninBermudaBhutanBoliviaBosnia and HerzegovinaBotswanaBrazilBrunei DarussalamBulgariaBurkina FasoBurundiCabo VerdeCambodiaCameroonCanadaCaribbean small statesCentral African RepublicCentral Europe and the BalticsChadChileChinaColombiaComorosCongo, Dem. Rep.Congo, Rep.Costa RicaCote d'IvoireCroatiaCuracaoCyprusCzech RepublicDenmarkDjiboutiDominicaDominican RepublicEarly-demographic dividendEast Asia & PacificEast Asia & Pacific (excluding high income)East Asia & Pacific (IDA & IBRD countries)EcuadorEgypt, Arab Rep.El SalvadorEquatorial GuineaEritreaEstoniaEthiopiaEuro areaEurope & Central AsiaEurope & Central Asia (excluding high income)Europe & Central Asia (IDA & IBRD countries)European UnionFaroe IslandsFijiFinlandFragile and conflict affected situationsFranceFrench PolynesiaGabonGambia, TheGeorgiaGermanyGhanaGreeceGrenadaGuatemalaGuineaGuinea-BissauGuyanaHaitiHeavily indebted poor countries (HIPC)High incomeHondurasHong Kong SAR, ChinaHungaryIBRD onlyIcelandIDA & IBRD totalIDA blendIDA onlyIDA totalIndiaIndonesiaIran, Islamic Rep.IraqIrelandIsraelItalyJamaicaJapanJordanKazakhstanKenyaKiribatiKorea, Rep.KosovoKuwaitKyrgyz RepublicLao PDRLate-demographic dividendLatin America & Caribbean Latin America & Caribbean (excluding high income)Latin America & the Caribbean (IDA & IBRD countries)LatviaLeast developed countries: UN classificationLebanonLesothoLiberiaLibyaLithuaniaLow & middle incomeLow incomeLower middle incomeLuxembourgMacao SAR, ChinaMacedonia, FYRMadagascarMalawiMalaysiaMaldivesMaliMaltaMarshall IslandsMauritaniaMauritiusMexicoMicronesia, Fed. Sts.Middle East & North AfricaMiddle East & North Africa (excluding high income)Middle East & North Africa (IDA & IBRD countries)Middle incomeMoldovaMongoliaMontenegroMoroccoMozambiqueMyanmarNamibiaNepalNetherlandsNew CaledoniaNew ZealandNicaraguaNigerNigeriaNorth AmericaNorwayOECD membersOmanOther small statesPacific island small statesPakistanPalauPanamaPapua New GuineaParaguayPeruPhilippinesPolandPortugalPost-demographic dividendPre-demographic dividendQatarRomaniaRussian FederationRwandaSamoaSao Tome and PrincipeSaudi ArabiaSenegalSerbiaSeychellesSierra LeoneSingaporeSint Maarten (Dutch part)Slovak RepublicSloveniaSmall statesSolomon IslandsSouth AfricaSouth AsiaSouth Asia (IDA & IBRD)South SudanSpainSri LankaSt. Kitts and NevisSt. LuciaSt. Vincent and the GrenadinesSub-Saharan Africa Sub-Saharan Africa (excluding high income)Sub-Saharan Africa (IDA & IBRD countries)SudanSurinameSwazilandSwedenSwitzerlandSyrian Arab RepublicTajikistanTanzaniaThailandTimor-LesteTogoTongaTrinidad and TobagoTunisiaTurkeyTuvaluUgandaUkraineUnited KingdomUnited StatesUpper middle incomeUruguayVanuatuVenezuela, RBVietnamWest Bank and GazaWorldYemen, Rep.ZambiaZimbabwe Timeline:
This timeline shows a graph from 1971 to 2014 of Barbados. No data until 1970. Number of actual observations by date: 44.
Source name:
World Development Indicators
Source organization:
International Monetary Fund, Balance of Payments Statistics Yearbook and data files.
Categories, topics:
Economy & Growth
Last updated:
apr 23, 2017
Indicators value changes by year
Minimum:
7.25 mln
jan 1, 1971
Maximum:
538.573 mln
jan 1, 2012
At the date of observation
Value
Absolute change
Change from previous value
jan 1, 1971
7.25 mln
+7.25 mln
0.0%
jan 1, 1972
8.051 mln
+801.138K
11.05%
jan 1, 1973
9.837 mln
+1.786 mln
22.18%
jan 1, 1974
12.403 mln
+2.566 mln
26.08%
jan 1, 1975
12.322 mln
-80.848K
-0.65%
jan 1, 1976
16.296 mln
+3.974 mln
32.25%
jan 1, 1977
8.25 mln
-8.046 mln
-49.37%
jan 1, 1978
12.0 mln
+3.75 mln
45.45%
jan 1, 1979
12.1 mln
+100.0K
0.83%
jan 1, 1980
21.0 mln
+8.9 mln
73.55%
jan 1, 1981
19.6 mln
-1.4 mln
-6.67%
jan 1, 1982
28.9 mln
+9.3 mln
47.45%
jan 1, 1983
31.0 mln
+2.1 mln
7.27%
jan 1, 1984
35.95 mln
+4.95 mln
15.97%
jan 1, 1985
44.4 mln
+8.45 mln
23.5%
jan 1, 1986
45.95 mln
+1.55 mln
3.49%
jan 1, 1987
62.2 mln
+16.25 mln
35.36%
jan 1, 1988
65.7 mln
+3.5 mln
5.63%
jan 1, 1989
64.55 mln
-1.15 mln
-1.75%
jan 1, 1990
60.15 mln
-4.4 mln
-6.82%
jan 1, 1991
75.7 mln
+15.55 mln
25.85%
jan 1, 1992
77.5 mln
+1.8 mln
2.38%
jan 1, 1993
68.05 mln
-9.45 mln
-12.19%
jan 1, 1994
83.55 mln
+15.5 mln
22.78%
jan 1, 1995
89.3 mln
+5.75 mln
6.88%
jan 1, 1996
97.7 mln
+8.4 mln
9.41%
jan 1, 1997
108.45 mln
+10.75 mln
11.0%
jan 1, 1998
110.2 mln
+1.75 mln
1.61%
jan 1, 1999
121.8 mln
+11.6 mln
10.53%
jan 1, 2000
140.35 mln
+18.55 mln
15.23%
jan 1, 2001
155.15 mln
+14.8 mln
10.55%
jan 1, 2002
169.1 mln
+13.95 mln
8.99%
jan 1, 2003
176.757 mln
+7.657 mln
4.53%
jan 1, 2004
185.028 mln
+8.271 mln
4.68%
jan 1, 2005
202.148 mln
+17.12 mln
9.25%
jan 1, 2006
294.891 mln
+92.743 mln
45.88%
jan 1, 2007
367.444 mln
+72.553 mln
24.6%
jan 1, 2008
387.997 mln
+20.553 mln
5.59%
jan 1, 2009
424.505 mln
+36.509 mln
9.41%
jan 1, 2010
463.549 mln
+39.044 mln
9.2%
jan 1, 2011
348.112 mln
-115.437 mln
-24.9%
jan 1, 2012
538.573 mln
+190.461 mln
54.71%
jan 1, 2013
502.533 mln
-36.04 mln
-6.69%
jan 1, 2014
391.921 mln
-110.612 mln
-22.01%
Ranking of countries by current statistics by years


Comments: