29
/
en
AIzaSyAYiBZKx7MnpbEhh9jyipgxe19OcubqV5w
April 1, 2024
220153
Papua New Guinea
PNG
true
2
1
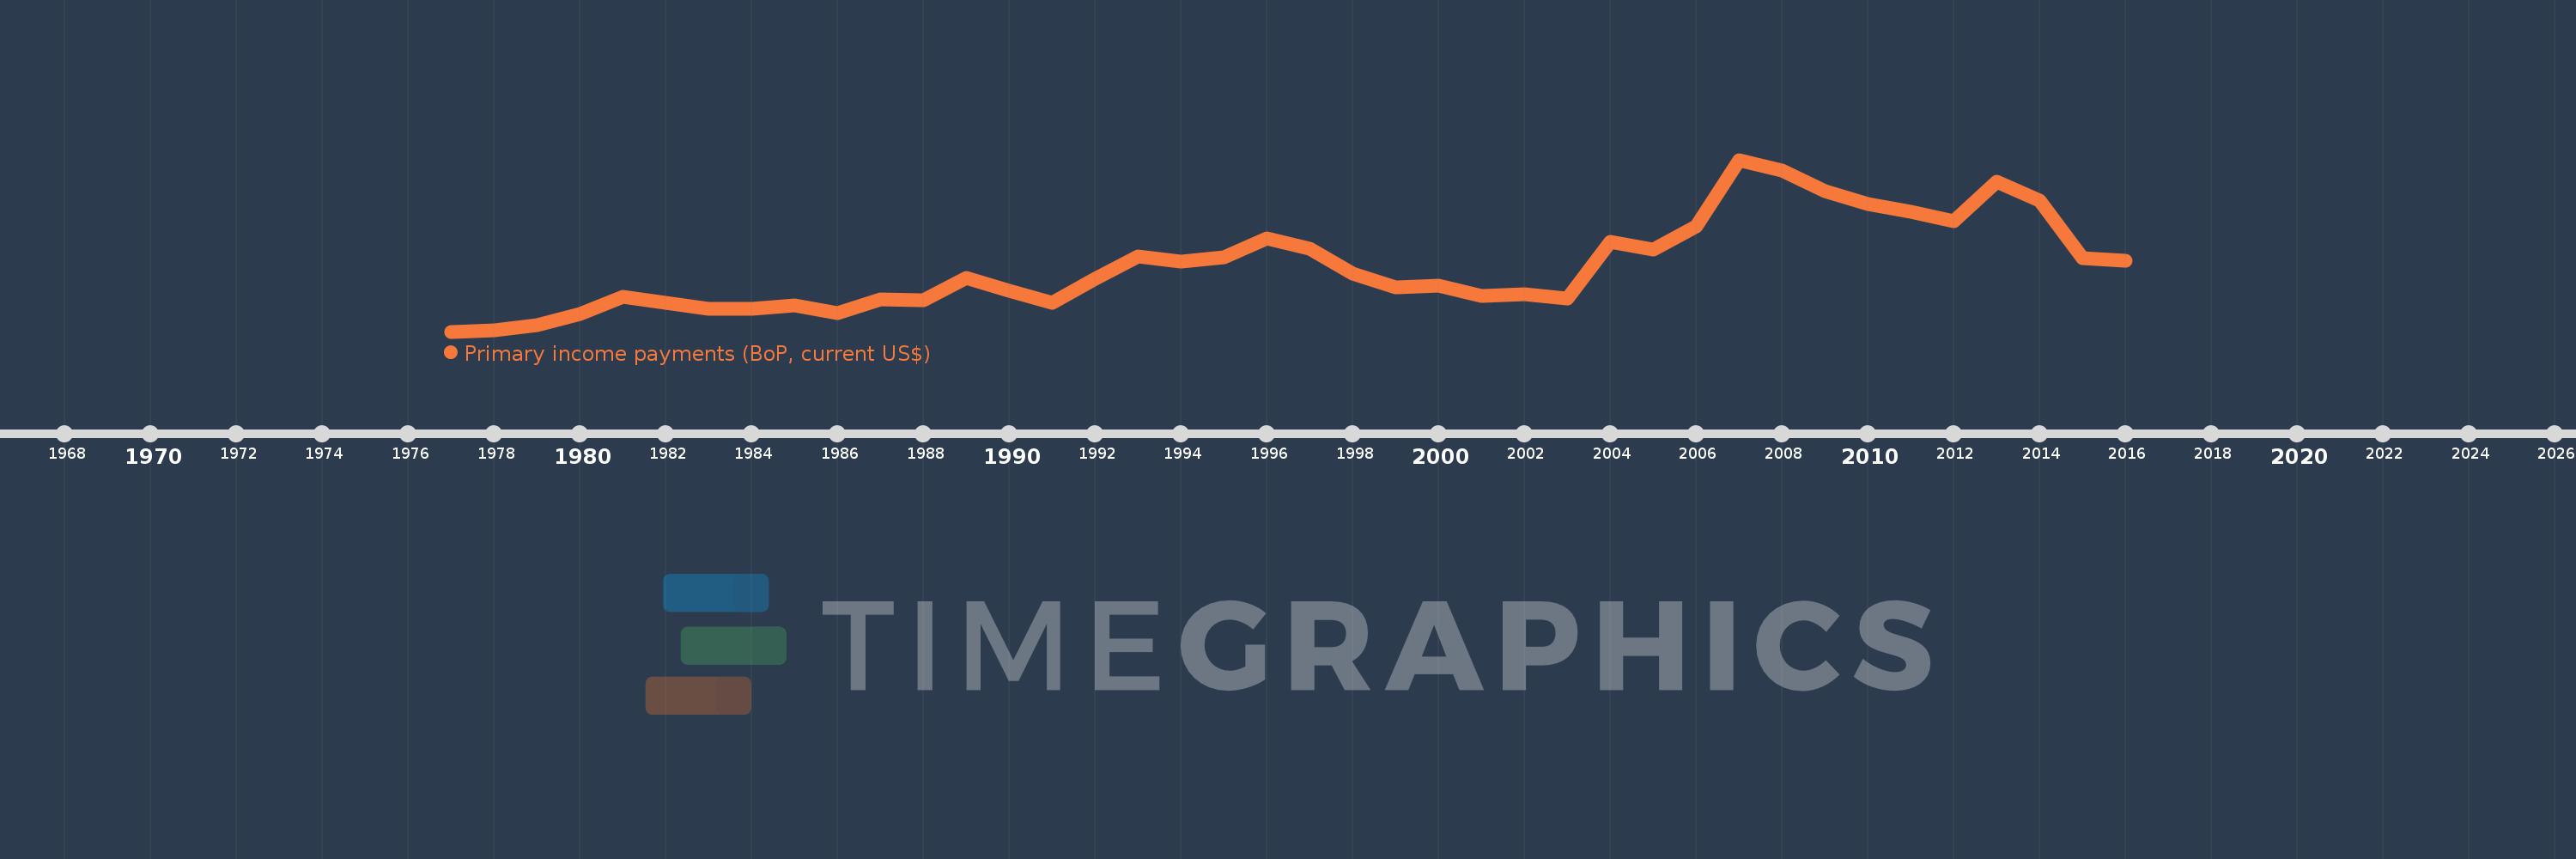
Primary income payments (BoP, current US$)
2016,2015,2014,2013,2012,2011,2010,2009,2008,2007,2006,2005,2004,2003,2002,2001,2000,1999,1998,1997,1996,1995,1994,1993,1992,1991,1990,1989,1988,1987,1986,1985,1984,1983,1982,1981,1980,1979,1978,1977
This statistics in other country:
AfghanistanAlbaniaAlgeriaAngolaAntigua and BarbudaArab WorldArgentinaArmeniaArubaAustraliaAustriaAzerbaijanBahamas, TheBahrainBangladeshBarbadosBelarusBelgiumBelizeBeninBermudaBhutanBoliviaBosnia and HerzegovinaBotswanaBrazilBrunei DarussalamBulgariaBurkina FasoBurundiCabo VerdeCambodiaCameroonCanadaCaribbean small statesCentral African RepublicCentral Europe and the BalticsChadChileChinaColombiaComorosCongo, Dem. Rep.Congo, Rep.Costa RicaCote d'IvoireCroatiaCuracaoCyprusCzech RepublicDenmarkDjiboutiDominicaDominican RepublicEarly-demographic dividendEast Asia & PacificEast Asia & Pacific (excluding high income)East Asia & Pacific (IDA & IBRD countries)EcuadorEgypt, Arab Rep.El SalvadorEquatorial GuineaEritreaEstoniaEthiopiaEuro areaEurope & Central AsiaEurope & Central Asia (excluding high income)Europe & Central Asia (IDA & IBRD countries)European UnionFaroe IslandsFijiFinlandFragile and conflict affected situationsFranceFrench PolynesiaGabonGambia, TheGeorgiaGermanyGhanaGreeceGrenadaGuatemalaGuineaGuinea-BissauGuyanaHaitiHeavily indebted poor countries (HIPC)High incomeHondurasHong Kong SAR, ChinaHungaryIBRD onlyIcelandIDA & IBRD totalIDA blendIDA onlyIDA totalIndiaIndonesiaIran, Islamic Rep.IraqIrelandIsraelItalyJamaicaJapanJordanKazakhstanKenyaKiribatiKorea, Rep.KosovoKuwaitKyrgyz RepublicLao PDRLate-demographic dividendLatin America & Caribbean Latin America & Caribbean (excluding high income)Latin America & the Caribbean (IDA & IBRD countries)LatviaLeast developed countries: UN classificationLebanonLesothoLiberiaLibyaLithuaniaLow & middle incomeLow incomeLower middle incomeLuxembourgMacao SAR, ChinaMacedonia, FYRMadagascarMalawiMalaysiaMaldivesMaliMaltaMarshall IslandsMauritaniaMauritiusMexicoMicronesia, Fed. Sts.Middle East & North AfricaMiddle East & North Africa (excluding high income)Middle East & North Africa (IDA & IBRD countries)Middle incomeMoldovaMongoliaMontenegroMoroccoMozambiqueMyanmarNamibiaNepalNetherlandsNew CaledoniaNew ZealandNicaraguaNigerNigeriaNorth AmericaNorwayOECD membersOmanOther small statesPacific island small statesPakistanPalauPanamaPapua New GuineaParaguayPeruPhilippinesPolandPortugalPost-demographic dividendPre-demographic dividendQatarRomaniaRussian FederationRwandaSamoaSao Tome and PrincipeSaudi ArabiaSenegalSerbiaSeychellesSierra LeoneSingaporeSint Maarten (Dutch part)Slovak RepublicSloveniaSmall statesSolomon IslandsSouth AfricaSouth AsiaSouth Asia (IDA & IBRD)South SudanSpainSri LankaSt. Kitts and NevisSt. LuciaSt. Vincent and the GrenadinesSub-Saharan Africa Sub-Saharan Africa (excluding high income)Sub-Saharan Africa (IDA & IBRD countries)SudanSurinameSwazilandSwedenSwitzerlandSyrian Arab RepublicTajikistanTanzaniaThailandTimor-LesteTogoTongaTrinidad and TobagoTunisiaTurkeyTuvaluUgandaUkraineUnited KingdomUnited StatesUpper middle incomeUruguayVanuatuVenezuela, RBVietnamWest Bank and GazaWorldYemen, Rep.ZambiaZimbabwe Timeline:
This timeline shows a graph from 1977 to 2016 of Papua New Guinea. No data until 1976. Number of actual observations by date: 40.
Source name:
World Development Indicators
Source organization:
International Monetary Fund, Balance of Payments Statistics Yearbook and data files.
Categories, topics:
Economy & Growth
Last updated:
apr 23, 2017
Indicators value changes by year
Minimum:
75.178 mln
jan 1, 1977
Maximum:
875.771 mln
jan 1, 2007
At the date of observation
Value
Absolute change
Change from previous value
jan 1, 1977
75.178 mln
+75.178 mln
0.0%
jan 1, 1978
81.293 mln
+6.114 mln
8.13%
jan 1, 1979
103.393 mln
+22.1 mln
27.19%
jan 1, 1980
158.148 mln
+54.755 mln
52.96%
jan 1, 1981
238.955 mln
+80.806 mln
51.1%
jan 1, 1982
209.151 mln
-29.803 mln
-12.47%
jan 1, 1983
180.908 mln
-28.244 mln
-13.5%
jan 1, 1984
180.276 mln
-631.877K
-0.35%
jan 1, 1985
199.163 mln
+18.887 mln
10.48%
jan 1, 1986
161.79 mln
-37.372 mln
-18.76%
jan 1, 1987
227.242 mln
+65.452 mln
40.45%
jan 1, 1988
219.364 mln
-7.878 mln
-3.47%
jan 1, 1989
326.166 mln
+106.802 mln
48.69%
jan 1, 1990
265.156 mln
-61.01 mln
-18.71%
jan 1, 1991
209.859 mln
-55.297 mln
-20.85%
jan 1, 1992
320.369 mln
+110.51 mln
52.66%
jan 1, 1993
425.318 mln
+104.95 mln
32.76%
jan 1, 1994
400.172 mln
-25.146 mln
-5.91%
jan 1, 1995
423.425 mln
+23.253 mln
5.81%
jan 1, 1996
510.67 mln
+87.246 mln
20.6%
jan 1, 1997
461.185 mln
-49.485 mln
-9.69%
jan 1, 1998
344.804 mln
-116.381 mln
-25.24%
jan 1, 1999
279.742 mln
-65.062 mln
-18.87%
jan 1, 2000
291.123 mln
+11.381 mln
4.07%
jan 1, 2001
242.098 mln
-49.025 mln
-16.84%
jan 1, 2002
250.223 mln
+8.125 mln
3.36%
jan 1, 2003
229.435 mln
-20.788 mln
-8.31%
jan 1, 2004
492.949 mln
+263.514 mln
114.85%
jan 1, 2005
456.007 mln
-36.942 mln
-7.49%
jan 1, 2006
564.613 mln
+108.606 mln
23.82%
jan 1, 2007
875.771 mln
+311.158 mln
55.11%
jan 1, 2008
823.951 mln
-51.82 mln
-5.92%
jan 1, 2009
729.198 mln
-94.753 mln
-11.5%
jan 1, 2010
671.108 mln
-58.09 mln
-7.97%
jan 1, 2011
634.025 mln
-37.084 mln
-5.53%
jan 1, 2012
590.687 mln
-43.338 mln
-6.84%
jan 1, 2013
774.315 mln
+183.628 mln
31.09%
jan 1, 2014
683.846 mln
-90.469 mln
-11.68%
jan 1, 2015
418.017 mln
-265.83 mln
-38.87%
jan 1, 2016
405.576 mln
-12.441 mln
-2.98%
Ranking of countries by current statistics by years


Comments: