29
/
en
AIzaSyAYiBZKx7MnpbEhh9jyipgxe19OcubqV5w
April 1, 2024
276091
United Kingdom
GBR
true
2
1
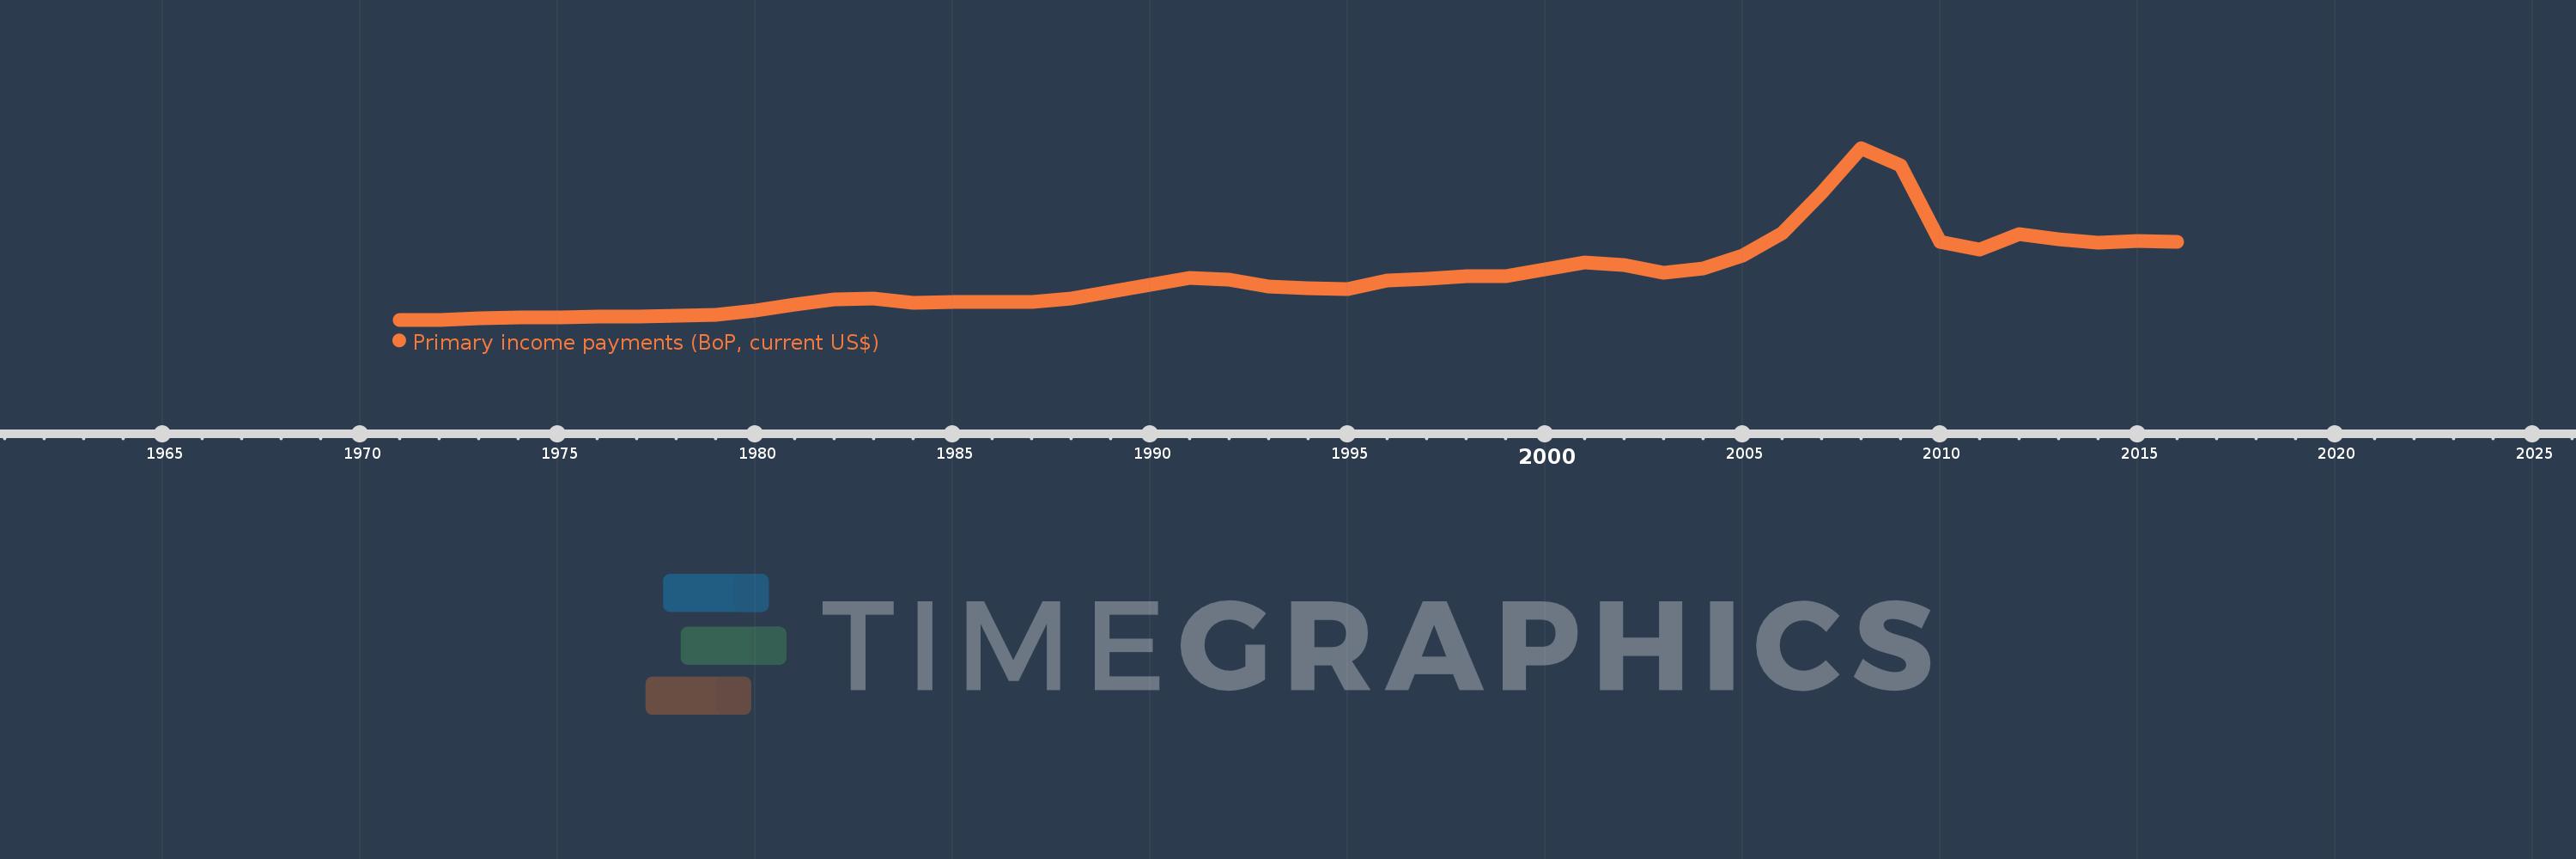
Primary income payments (BoP, current US$)
2016,2015,2014,2013,2012,2011,2010,2009,2008,2007,2006,2005,2004,2003,2002,2001,2000,1999,1998,1997,1996,1995,1994,1993,1992,1991,1990,1989,1988,1987,1986,1985,1984,1983,1982,1981,1980,1979,1978,1977,1976,1975,1974,1973,1972,1971
This statistics in other country:
AfghanistanAlbaniaAlgeriaAngolaAntigua and BarbudaArab WorldArgentinaArmeniaArubaAustraliaAustriaAzerbaijanBahamas, TheBahrainBangladeshBarbadosBelarusBelgiumBelizeBeninBermudaBhutanBoliviaBosnia and HerzegovinaBotswanaBrazilBrunei DarussalamBulgariaBurkina FasoBurundiCabo VerdeCambodiaCameroonCanadaCaribbean small statesCentral African RepublicCentral Europe and the BalticsChadChileChinaColombiaComorosCongo, Dem. Rep.Congo, Rep.Costa RicaCote d'IvoireCroatiaCuracaoCyprusCzech RepublicDenmarkDjiboutiDominicaDominican RepublicEarly-demographic dividendEast Asia & PacificEast Asia & Pacific (excluding high income)East Asia & Pacific (IDA & IBRD countries)EcuadorEgypt, Arab Rep.El SalvadorEquatorial GuineaEritreaEstoniaEthiopiaEuro areaEurope & Central AsiaEurope & Central Asia (excluding high income)Europe & Central Asia (IDA & IBRD countries)European UnionFaroe IslandsFijiFinlandFragile and conflict affected situationsFranceFrench PolynesiaGabonGambia, TheGeorgiaGermanyGhanaGreeceGrenadaGuatemalaGuineaGuinea-BissauGuyanaHaitiHeavily indebted poor countries (HIPC)High incomeHondurasHong Kong SAR, ChinaHungaryIBRD onlyIcelandIDA & IBRD totalIDA blendIDA onlyIDA totalIndiaIndonesiaIran, Islamic Rep.IraqIrelandIsraelItalyJamaicaJapanJordanKazakhstanKenyaKiribatiKorea, Rep.KosovoKuwaitKyrgyz RepublicLao PDRLate-demographic dividendLatin America & Caribbean Latin America & Caribbean (excluding high income)Latin America & the Caribbean (IDA & IBRD countries)LatviaLeast developed countries: UN classificationLebanonLesothoLiberiaLibyaLithuaniaLow & middle incomeLow incomeLower middle incomeLuxembourgMacao SAR, ChinaMacedonia, FYRMadagascarMalawiMalaysiaMaldivesMaliMaltaMarshall IslandsMauritaniaMauritiusMexicoMicronesia, Fed. Sts.Middle East & North AfricaMiddle East & North Africa (excluding high income)Middle East & North Africa (IDA & IBRD countries)Middle incomeMoldovaMongoliaMontenegroMoroccoMozambiqueMyanmarNamibiaNepalNetherlandsNew CaledoniaNew ZealandNicaraguaNigerNigeriaNorth AmericaNorwayOECD membersOmanOther small statesPacific island small statesPakistanPalauPanamaPapua New GuineaParaguayPeruPhilippinesPolandPortugalPost-demographic dividendPre-demographic dividendQatarRomaniaRussian FederationRwandaSamoaSao Tome and PrincipeSaudi ArabiaSenegalSerbiaSeychellesSierra LeoneSingaporeSint Maarten (Dutch part)Slovak RepublicSloveniaSmall statesSolomon IslandsSouth AfricaSouth AsiaSouth Asia (IDA & IBRD)South SudanSpainSri LankaSt. Kitts and NevisSt. LuciaSt. Vincent and the GrenadinesSub-Saharan Africa Sub-Saharan Africa (excluding high income)Sub-Saharan Africa (IDA & IBRD countries)SudanSurinameSwazilandSwedenSwitzerlandSyrian Arab RepublicTajikistanTanzaniaThailandTimor-LesteTogoTongaTrinidad and TobagoTunisiaTurkeyTuvaluUgandaUkraineUnited KingdomUnited StatesUpper middle incomeUruguayVanuatuVenezuela, RBVietnamWest Bank and GazaWorldYemen, Rep.ZambiaZimbabwe Timeline:
This timeline shows a graph from 1971 to 2016 of United Kingdom. No data until 1970. Number of actual observations by date: 46.
Source name:
World Development Indicators
Source organization:
International Monetary Fund, Balance of Payments Statistics Yearbook and data files.
Categories, topics:
Economy & Growth
Last updated:
apr 23, 2017
Indicators value changes by year
Minimum:
2.155 bln
jan 1, 1971
Maximum:
591.952 bln
jan 1, 2008
At the date of observation
Value
Absolute change
Change from previous value
jan 1, 1971
2.155 bln
+2.155 bln
0.0%
jan 1, 1972
2.4 bln
+244.349 mln
11.34%
jan 1, 1973
7.015 bln
+4.616 bln
192.35%
jan 1, 1974
8.814 bln
+1.799 bln
25.64%
jan 1, 1975
10.993 bln
+2.179 bln
24.72%
jan 1, 1976
12.603 bln
+1.611 bln
14.65%
jan 1, 1977
12.294 bln
-309.894 mln
-2.46%
jan 1, 1978
14.938 bln
+2.645 bln
21.51%
jan 1, 1979
19.929 bln
+4.99 bln
33.4%
jan 1, 1980
34.687 bln
+14.759 bln
74.06%
jan 1, 1981
55.483 bln
+20.796 bln
59.95%
jan 1, 1982
72.344 bln
+16.861 bln
30.39%
jan 1, 1983
75.06 bln
+2.716 bln
3.75%
jan 1, 1984
60.073 bln
-14.987 bln
-19.97%
jan 1, 1985
62.792 bln
+2.719 bln
4.53%
jan 1, 1986
63.931 bln
+1.139 bln
1.81%
jan 1, 1987
62.595 bln
-1.336 bln
-2.09%
jan 1, 1988
76.401 bln
+13.807 bln
22.06%
jan 1, 1989
98.086 bln
+21.684 bln
28.38%
jan 1, 1990
120.744 bln
+22.659 bln
23.1%
jan 1, 1991
144.991 bln
+24.247 bln
20.08%
jan 1, 1992
139.634 bln
-5.357 bln
-3.69%
jan 1, 1993
116.995 bln
-22.639 bln
-16.21%
jan 1, 1994
109.666 bln
-7.329 bln
-6.26%
jan 1, 1995
108.864 bln
-802.092 mln
-0.73%
jan 1, 1996
135.586 bln
+26.721 bln
24.55%
jan 1, 1997
143.415 bln
+7.83 bln
5.77%
jan 1, 1998
152.525 bln
+9.11 bln
6.35%
jan 1, 1999
152.211 bln
-314.245 mln
-0.21%
jan 1, 2000
174.392 bln
+22.182 bln
14.57%
jan 1, 2001
197.676 bln
+23.283 bln
13.35%
jan 1, 2002
190.598 bln
-7.078 bln
-3.58%
jan 1, 2003
164.094 bln
-26.504 bln
-13.91%
jan 1, 2004
177.583 bln
+13.49 bln
8.22%
jan 1, 2005
223.1 bln
+45.516 bln
25.63%
jan 1, 2006
298.865 bln
+75.765 bln
33.96%
jan 1, 2007
437.916 bln
+139.051 bln
46.53%
jan 1, 2008
591.952 bln
+154.036 bln
35.17%
jan 1, 2009
533.549 bln
-58.403 bln
-9.87%
jan 1, 2010
270.644 bln
-262.905 bln
-49.27%
jan 1, 2011
244.224 bln
-26.42 bln
-9.76%
jan 1, 2012
296.026 bln
+51.802 bln
21.21%
jan 1, 2013
278.355 bln
-17.671 bln
-5.97%
jan 1, 2014
267.49 bln
-10.865 bln
-3.9%
jan 1, 2015
273.524 bln
+6.034 bln
2.26%
jan 1, 2016
269.557 bln
-3.966 bln
-1.45%
Ranking of countries by current statistics by years


Comments: