29
/
en
AIzaSyAYiBZKx7MnpbEhh9jyipgxe19OcubqV5w
April 1, 2024
194846
Mauritius
MUS
true
2
1
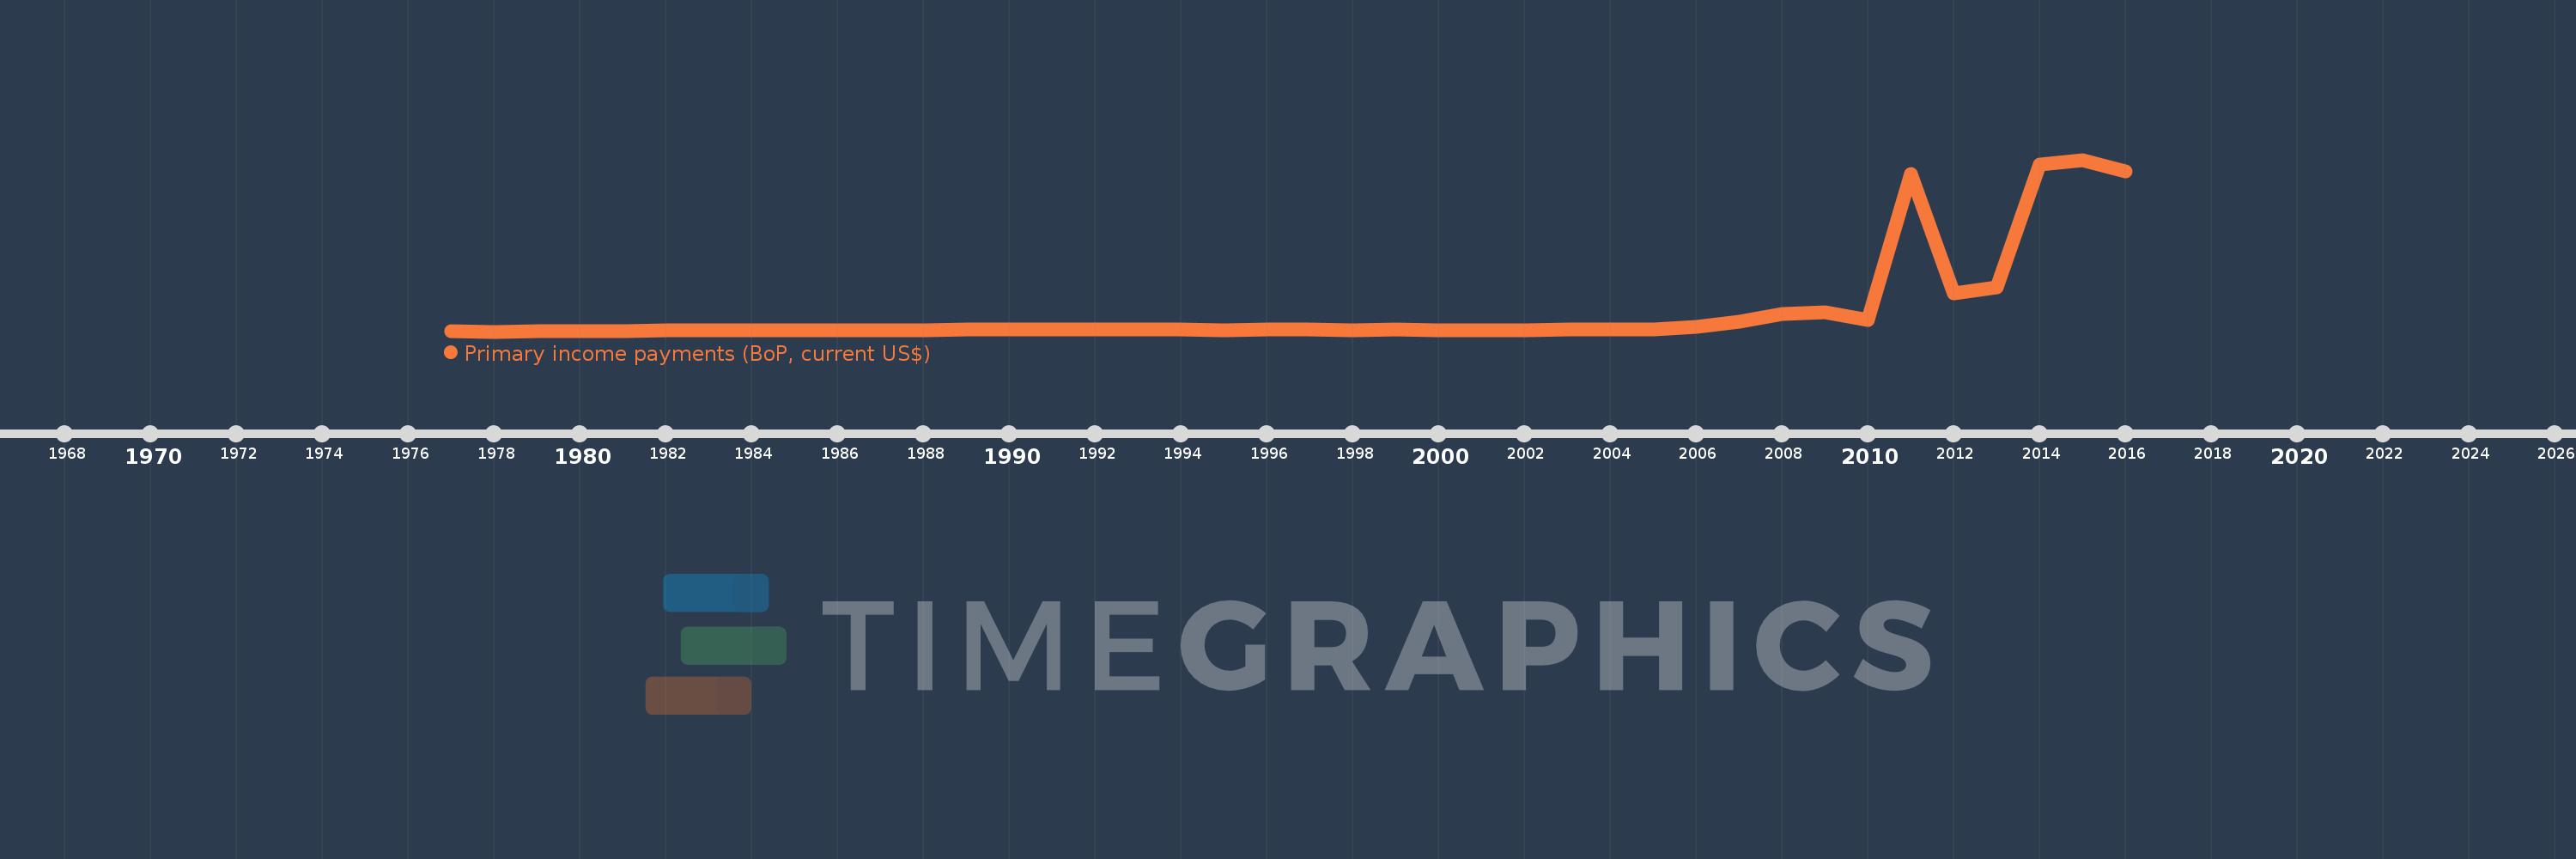
Primary income payments (BoP, current US$)
2016,2015,2014,2013,2012,2011,2010,2009,2008,2007,2006,2005,2004,2003,2002,2001,2000,1999,1998,1997,1996,1995,1994,1993,1992,1991,1990,1989,1988,1987,1986,1985,1984,1983,1982,1981,1980,1979,1978,1977
This statistics in other country:
AfghanistanAlbaniaAlgeriaAngolaAntigua and BarbudaArab WorldArgentinaArmeniaArubaAustraliaAustriaAzerbaijanBahamas, TheBahrainBangladeshBarbadosBelarusBelgiumBelizeBeninBermudaBhutanBoliviaBosnia and HerzegovinaBotswanaBrazilBrunei DarussalamBulgariaBurkina FasoBurundiCabo VerdeCambodiaCameroonCanadaCaribbean small statesCentral African RepublicCentral Europe and the BalticsChadChileChinaColombiaComorosCongo, Dem. Rep.Congo, Rep.Costa RicaCote d'IvoireCroatiaCuracaoCyprusCzech RepublicDenmarkDjiboutiDominicaDominican RepublicEarly-demographic dividendEast Asia & PacificEast Asia & Pacific (excluding high income)East Asia & Pacific (IDA & IBRD countries)EcuadorEgypt, Arab Rep.El SalvadorEquatorial GuineaEritreaEstoniaEthiopiaEuro areaEurope & Central AsiaEurope & Central Asia (excluding high income)Europe & Central Asia (IDA & IBRD countries)European UnionFaroe IslandsFijiFinlandFragile and conflict affected situationsFranceFrench PolynesiaGabonGambia, TheGeorgiaGermanyGhanaGreeceGrenadaGuatemalaGuineaGuinea-BissauGuyanaHaitiHeavily indebted poor countries (HIPC)High incomeHondurasHong Kong SAR, ChinaHungaryIBRD onlyIcelandIDA & IBRD totalIDA blendIDA onlyIDA totalIndiaIndonesiaIran, Islamic Rep.IraqIrelandIsraelItalyJamaicaJapanJordanKazakhstanKenyaKiribatiKorea, Rep.KosovoKuwaitKyrgyz RepublicLao PDRLate-demographic dividendLatin America & Caribbean Latin America & Caribbean (excluding high income)Latin America & the Caribbean (IDA & IBRD countries)LatviaLeast developed countries: UN classificationLebanonLesothoLiberiaLibyaLithuaniaLow & middle incomeLow incomeLower middle incomeLuxembourgMacao SAR, ChinaMacedonia, FYRMadagascarMalawiMalaysiaMaldivesMaliMaltaMarshall IslandsMauritaniaMauritiusMexicoMicronesia, Fed. Sts.Middle East & North AfricaMiddle East & North Africa (excluding high income)Middle East & North Africa (IDA & IBRD countries)Middle incomeMoldovaMongoliaMontenegroMoroccoMozambiqueMyanmarNamibiaNepalNetherlandsNew CaledoniaNew ZealandNicaraguaNigerNigeriaNorth AmericaNorwayOECD membersOmanOther small statesPacific island small statesPakistanPalauPanamaPapua New GuineaParaguayPeruPhilippinesPolandPortugalPost-demographic dividendPre-demographic dividendQatarRomaniaRussian FederationRwandaSamoaSao Tome and PrincipeSaudi ArabiaSenegalSerbiaSeychellesSierra LeoneSingaporeSint Maarten (Dutch part)Slovak RepublicSloveniaSmall statesSolomon IslandsSouth AfricaSouth AsiaSouth Asia (IDA & IBRD)South SudanSpainSri LankaSt. Kitts and NevisSt. LuciaSt. Vincent and the GrenadinesSub-Saharan Africa Sub-Saharan Africa (excluding high income)Sub-Saharan Africa (IDA & IBRD countries)SudanSurinameSwazilandSwedenSwitzerlandSyrian Arab RepublicTajikistanTanzaniaThailandTimor-LesteTogoTongaTrinidad and TobagoTunisiaTurkeyTuvaluUgandaUkraineUnited KingdomUnited StatesUpper middle incomeUruguayVanuatuVenezuela, RBVietnamWest Bank and GazaWorldYemen, Rep.ZambiaZimbabwe Timeline:
This timeline shows a graph from 1977 to 2016 of Mauritius. No data until 1976. Number of actual observations by date: 40.
Source name:
World Development Indicators
Source organization:
International Monetary Fund, Balance of Payments Statistics Yearbook and data files.
Categories, topics:
Economy & Growth
Last updated:
apr 23, 2017
Indicators value changes by year
Minimum:
7.87 mln
jan 1, 1978
Maximum:
5.727 bln
jan 1, 2015
At the date of observation
Value
Absolute change
Change from previous value
jan 1, 1977
8.83 mln
+8.83 mln
0.0%
jan 1, 1978
7.87 mln
-960.246K
-10.87%
jan 1, 1979
13.467 mln
+5.597 mln
71.11%
jan 1, 1980
20.608 mln
+7.142 mln
53.03%
jan 1, 1981
28.239 mln
+7.631 mln
37.03%
jan 1, 1982
52.593 mln
+24.354 mln
86.24%
jan 1, 1983
49.758 mln
-2.835 mln
-5.39%
jan 1, 1984
43.908 mln
-5.85 mln
-11.76%
jan 1, 1985
48.26 mln
+4.351 mln
9.91%
jan 1, 1986
47.272 mln
-987.514K
-2.05%
jan 1, 1987
59.779 mln
+12.506 mln
26.46%
jan 1, 1988
55.365 mln
-4.414 mln
-7.38%
jan 1, 1989
70.696 mln
+15.332 mln
27.69%
jan 1, 1990
70.886 mln
+189.84K
0.27%
jan 1, 1991
78.716 mln
+7.83 mln
11.05%
jan 1, 1992
76.858 mln
-1.859 mln
-2.36%
jan 1, 1993
80.061 mln
+3.203 mln
4.17%
jan 1, 1994
66.466 mln
-13.594 mln
-16.98%
jan 1, 1995
56.402 mln
-10.064 mln
-15.14%
jan 1, 1996
71.32 mln
+14.918 mln
26.45%
jan 1, 1997
75.106 mln
+3.785 mln
5.31%
jan 1, 1998
64.633 mln
-10.472 mln
-13.94%
jan 1, 1999
74.398 mln
+9.764 mln
15.11%
jan 1, 2000
59.518 mln
-14.88 mln
-20.0%
jan 1, 2001
64.867 mln
+5.349 mln
8.99%
jan 1, 2002
60.914 mln
-3.952 mln
-6.09%
jan 1, 2003
66.692 mln
+5.777 mln
9.48%
jan 1, 2004
77.081 mln
+10.39 mln
15.58%
jan 1, 2005
65.689 mln
-11.392 mln
-14.78%
jan 1, 2006
151.333 mln
+85.644 mln
130.38%
jan 1, 2007
323.824 mln
+172.491 mln
113.98%
jan 1, 2008
593.268 mln
+269.444 mln
83.21%
jan 1, 2009
641.704 mln
+48.436 mln
8.16%
jan 1, 2010
402.576 mln
-239.128 mln
-37.26%
jan 1, 2011
5.242 bln
+4.839 bln
1.2K%
jan 1, 2012
1.276 bln
-3.966 bln
-75.66%
jan 1, 2013
1.469 bln
+192.901 mln
15.12%
jan 1, 2014
5.576 bln
+4.107 bln
279.6%
jan 1, 2015
5.727 bln
+150.612 mln
2.7%
jan 1, 2016
5.346 bln
-380.784 mln
-6.65%
Ranking of countries by current statistics by years


Comments: