29
/
en
AIzaSyAYiBZKx7MnpbEhh9jyipgxe19OcubqV5w
April 1, 2024
165456
Jordan
JOR
true
2
1
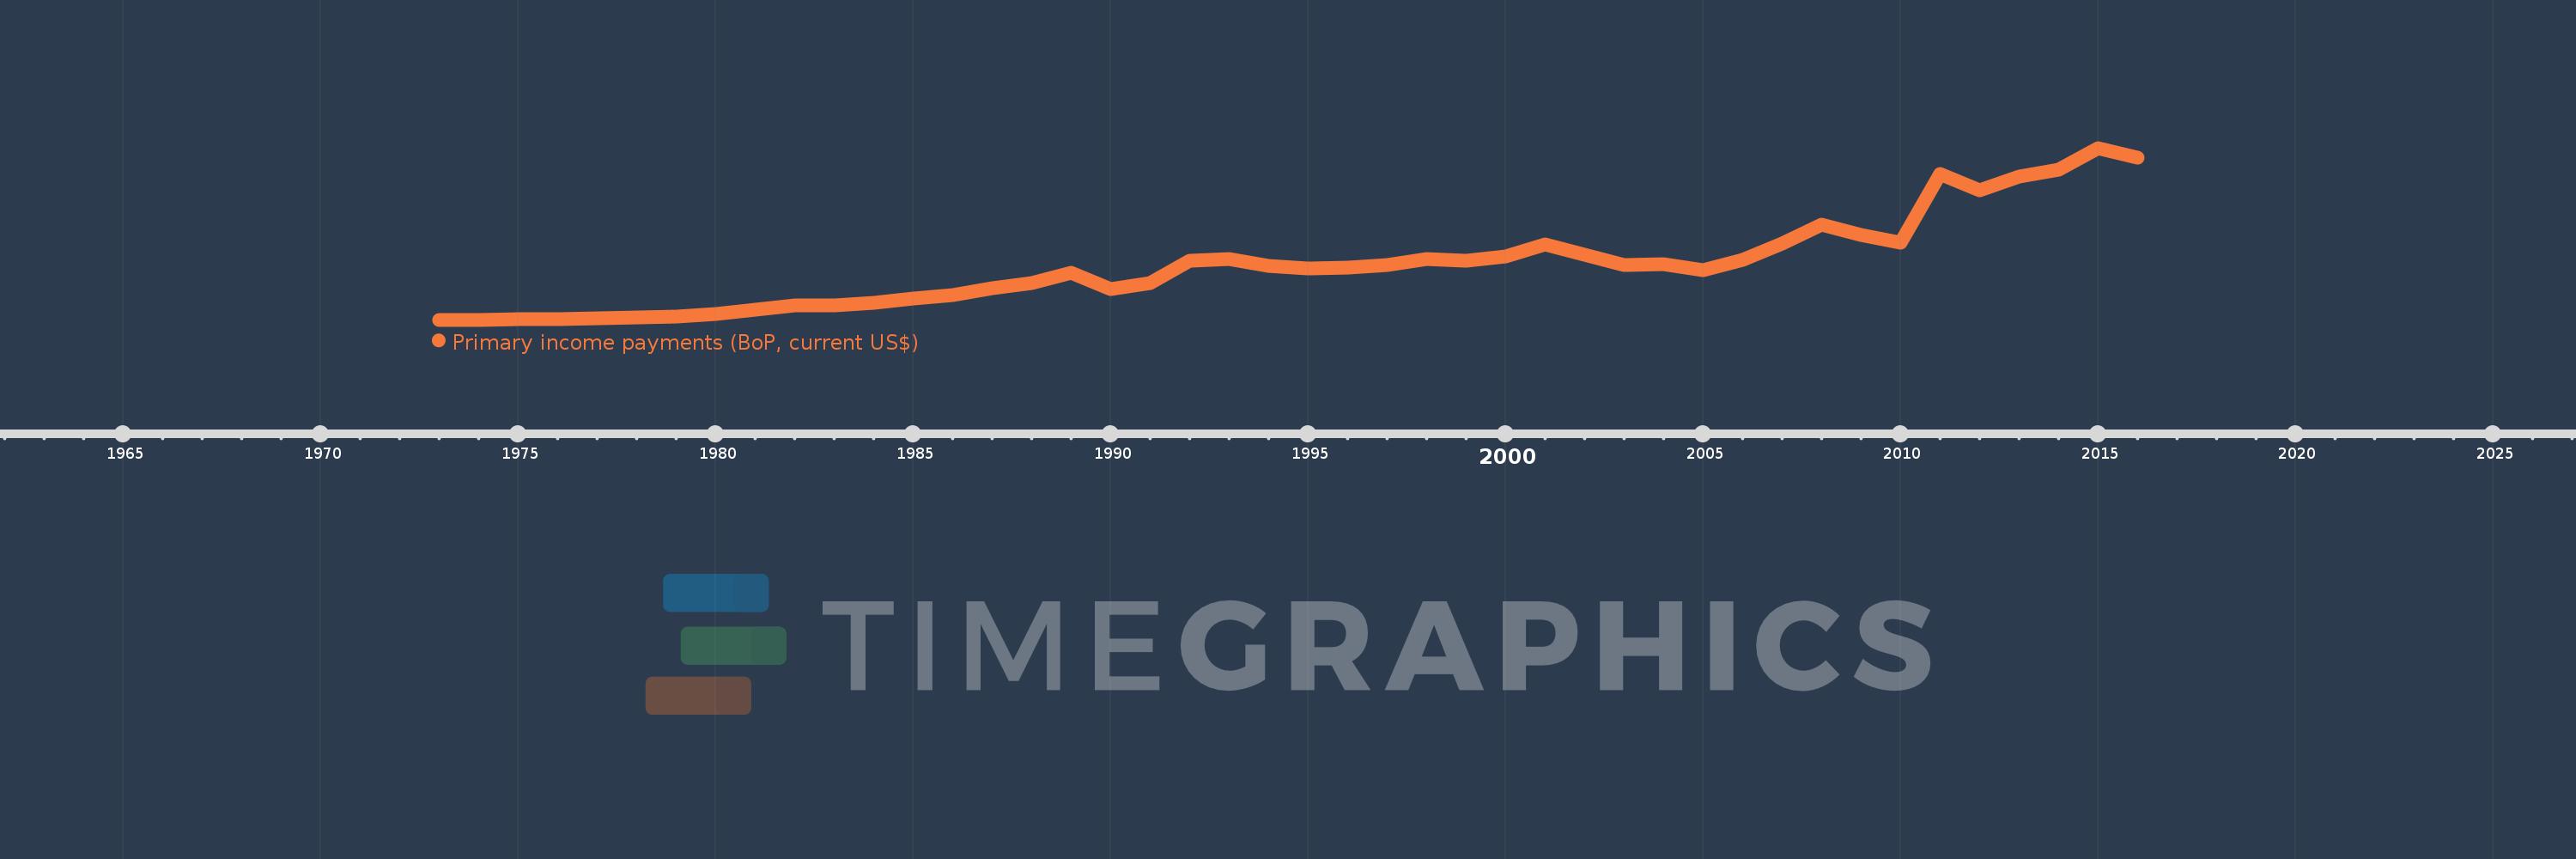
Primary income payments (BoP, current US$)
2016,2015,2014,2013,2012,2011,2010,2009,2008,2007,2006,2005,2004,2003,2002,2001,2000,1999,1998,1997,1996,1995,1994,1993,1992,1991,1990,1989,1988,1987,1986,1985,1984,1983,1982,1981,1980,1979,1978,1977,1976,1975,1974,1973
This statistics in other country:
AfghanistanAlbaniaAlgeriaAngolaAntigua and BarbudaArab WorldArgentinaArmeniaArubaAustraliaAustriaAzerbaijanBahamas, TheBahrainBangladeshBarbadosBelarusBelgiumBelizeBeninBermudaBhutanBoliviaBosnia and HerzegovinaBotswanaBrazilBrunei DarussalamBulgariaBurkina FasoBurundiCabo VerdeCambodiaCameroonCanadaCaribbean small statesCentral African RepublicCentral Europe and the BalticsChadChileChinaColombiaComorosCongo, Dem. Rep.Congo, Rep.Costa RicaCote d'IvoireCroatiaCuracaoCyprusCzech RepublicDenmarkDjiboutiDominicaDominican RepublicEarly-demographic dividendEast Asia & PacificEast Asia & Pacific (excluding high income)East Asia & Pacific (IDA & IBRD countries)EcuadorEgypt, Arab Rep.El SalvadorEquatorial GuineaEritreaEstoniaEthiopiaEuro areaEurope & Central AsiaEurope & Central Asia (excluding high income)Europe & Central Asia (IDA & IBRD countries)European UnionFaroe IslandsFijiFinlandFragile and conflict affected situationsFranceFrench PolynesiaGabonGambia, TheGeorgiaGermanyGhanaGreeceGrenadaGuatemalaGuineaGuinea-BissauGuyanaHaitiHeavily indebted poor countries (HIPC)High incomeHondurasHong Kong SAR, ChinaHungaryIBRD onlyIcelandIDA & IBRD totalIDA blendIDA onlyIDA totalIndiaIndonesiaIran, Islamic Rep.IraqIrelandIsraelItalyJamaicaJapanJordanKazakhstanKenyaKiribatiKorea, Rep.KosovoKuwaitKyrgyz RepublicLao PDRLate-demographic dividendLatin America & Caribbean Latin America & Caribbean (excluding high income)Latin America & the Caribbean (IDA & IBRD countries)LatviaLeast developed countries: UN classificationLebanonLesothoLiberiaLibyaLithuaniaLow & middle incomeLow incomeLower middle incomeLuxembourgMacao SAR, ChinaMacedonia, FYRMadagascarMalawiMalaysiaMaldivesMaliMaltaMarshall IslandsMauritaniaMauritiusMexicoMicronesia, Fed. Sts.Middle East & North AfricaMiddle East & North Africa (excluding high income)Middle East & North Africa (IDA & IBRD countries)Middle incomeMoldovaMongoliaMontenegroMoroccoMozambiqueMyanmarNamibiaNepalNetherlandsNew CaledoniaNew ZealandNicaraguaNigerNigeriaNorth AmericaNorwayOECD membersOmanOther small statesPacific island small statesPakistanPalauPanamaPapua New GuineaParaguayPeruPhilippinesPolandPortugalPost-demographic dividendPre-demographic dividendQatarRomaniaRussian FederationRwandaSamoaSao Tome and PrincipeSaudi ArabiaSenegalSerbiaSeychellesSierra LeoneSingaporeSint Maarten (Dutch part)Slovak RepublicSloveniaSmall statesSolomon IslandsSouth AfricaSouth AsiaSouth Asia (IDA & IBRD)South SudanSpainSri LankaSt. Kitts and NevisSt. LuciaSt. Vincent and the GrenadinesSub-Saharan Africa Sub-Saharan Africa (excluding high income)Sub-Saharan Africa (IDA & IBRD countries)SudanSurinameSwazilandSwedenSwitzerlandSyrian Arab RepublicTajikistanTanzaniaThailandTimor-LesteTogoTongaTrinidad and TobagoTunisiaTurkeyTuvaluUgandaUkraineUnited KingdomUnited StatesUpper middle incomeUruguayVanuatuVenezuela, RBVietnamWest Bank and GazaWorldYemen, Rep.ZambiaZimbabwe Timeline:
This timeline shows a graph from 1973 to 2016 of Jordan. No data until 1972. Number of actual observations by date: 44.
Source name:
World Development Indicators
Source organization:
International Monetary Fund, Balance of Payments Statistics Yearbook and data files.
Categories, topics:
Economy & Growth
Last updated:
apr 23, 2017
Indicators value changes by year
Minimum:
2.8 mln
jan 1, 1973
Maximum:
1.297 bln
jan 1, 2015
At the date of observation
Value
Absolute change
Change from previous value
jan 1, 1973
2.8 mln
+2.8 mln
0.0%
jan 1, 1974
3.957 mln
+1.157 mln
41.3%
jan 1, 1975
6.52 mln
+2.563 mln
64.79%
jan 1, 1976
9.694 mln
+3.174 mln
48.68%
jan 1, 1977
14.157 mln
+4.464 mln
46.05%
jan 1, 1978
18.224 mln
+4.067 mln
28.73%
jan 1, 1979
24.657 mln
+6.433 mln
35.3%
jan 1, 1980
48.952 mln
+24.295 mln
98.53%
jan 1, 1981
78.865 mln
+29.913 mln
61.11%
jan 1, 1982
113.012 mln
+34.147 mln
43.3%
jan 1, 1983
111.952 mln
-1.06 mln
-0.94%
jan 1, 1984
127.931 mln
+15.979 mln
14.27%
jan 1, 1985
161.367 mln
+33.436 mln
26.14%
jan 1, 1986
189.623 mln
+28.257 mln
17.51%
jan 1, 1987
240.385 mln
+50.762 mln
26.77%
jan 1, 1988
278.563 mln
+38.178 mln
15.88%
jan 1, 1989
354.755 mln
+76.191 mln
27.35%
jan 1, 1990
235.608 mln
-119.146 mln
-33.59%
jan 1, 1991
281.764 mln
+46.156 mln
19.59%
jan 1, 1992
447.664 mln
+165.901 mln
58.88%
jan 1, 1993
459.982 mln
+12.317 mln
2.75%
jan 1, 1994
409.417 mln
-50.565 mln
-10.99%
jan 1, 1995
387.455 mln
-21.962 mln
-5.36%
jan 1, 1996
394.523 mln
+7.068 mln
1.82%
jan 1, 1997
412.694 mln
+18.171 mln
4.61%
jan 1, 1998
456.982 mln
+44.288 mln
10.73%
jan 1, 1999
444.993 mln
-11.989 mln
-2.62%
jan 1, 2000
479.69 mln
+34.697 mln
7.8%
jan 1, 2001
567.582 mln
+87.892 mln
18.32%
jan 1, 2002
490.076 mln
-77.506 mln
-13.66%
jan 1, 2003
414.744 mln
-75.332 mln
-15.37%
jan 1, 2004
420.474 mln
+5.73 mln
1.38%
jan 1, 2005
374.881 mln
-45.592 mln
-10.84%
jan 1, 2006
454.589 mln
+79.707 mln
21.26%
jan 1, 2007
578.829 mln
+124.241 mln
27.33%
jan 1, 2008
720.337 mln
+141.507 mln
24.45%
jan 1, 2009
640.057 mln
-80.28 mln
-11.14%
jan 1, 2010
585.16 mln
-54.897 mln
-8.58%
jan 1, 2011
1.102 bln
+516.549 mln
88.27%
jan 1, 2012
974.862 mln
-126.847 mln
-11.51%
jan 1, 2013
1.078 bln
+103.276 mln
10.59%
jan 1, 2014
1.132 bln
+54.171 mln
5.02%
jan 1, 2015
1.297 bln
+164.451 mln
14.52%
jan 1, 2016
1.226 bln
-70.845 mln
-5.46%
Ranking of countries by current statistics by years


Comments: