29
/
en
AIzaSyAYiBZKx7MnpbEhh9jyipgxe19OcubqV5w
April 1, 2024
43815
Latin America & the Caribbean (IDA & IBRD countries)
TLA
false
2
1
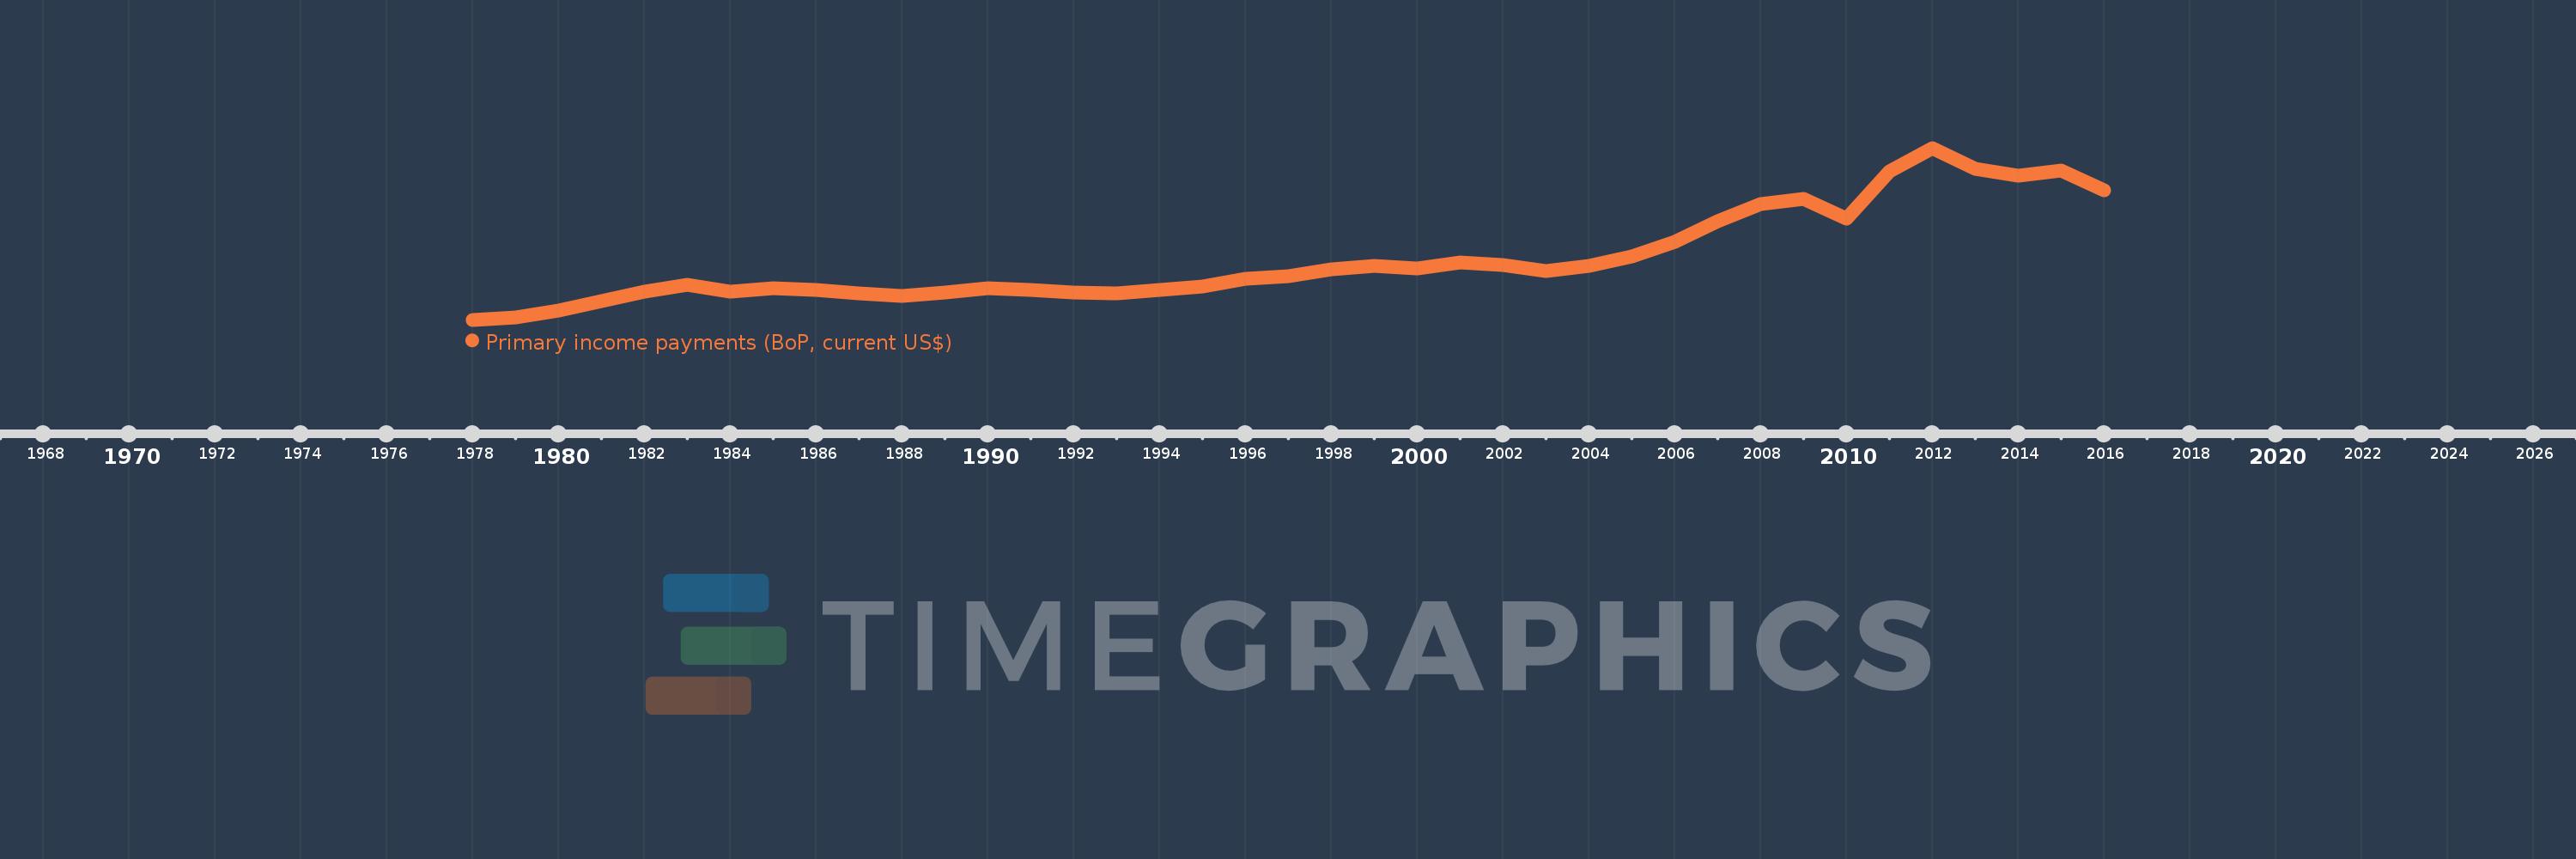
Primary income payments (BoP, current US$)
2016,2015,2014,2013,2012,2011,2010,2009,2008,2007,2006,2005,2004,2003,2002,2001,2000,1999,1998,1997,1996,1995,1994,1993,1992,1991,1990,1989,1988,1987,1986,1985,1984,1983,1982,1981,1980,1979,1978
This statistics in other country:
AfghanistanAlbaniaAlgeriaAngolaAntigua and BarbudaArab WorldArgentinaArmeniaArubaAustraliaAustriaAzerbaijanBahamas, TheBahrainBangladeshBarbadosBelarusBelgiumBelizeBeninBermudaBhutanBoliviaBosnia and HerzegovinaBotswanaBrazilBrunei DarussalamBulgariaBurkina FasoBurundiCabo VerdeCambodiaCameroonCanadaCaribbean small statesCentral African RepublicCentral Europe and the BalticsChadChileChinaColombiaComorosCongo, Dem. Rep.Congo, Rep.Costa RicaCote d'IvoireCroatiaCuracaoCyprusCzech RepublicDenmarkDjiboutiDominicaDominican RepublicEarly-demographic dividendEast Asia & PacificEast Asia & Pacific (excluding high income)East Asia & Pacific (IDA & IBRD countries)EcuadorEgypt, Arab Rep.El SalvadorEquatorial GuineaEritreaEstoniaEthiopiaEuro areaEurope & Central AsiaEurope & Central Asia (excluding high income)Europe & Central Asia (IDA & IBRD countries)European UnionFaroe IslandsFijiFinlandFragile and conflict affected situationsFranceFrench PolynesiaGabonGambia, TheGeorgiaGermanyGhanaGreeceGrenadaGuatemalaGuineaGuinea-BissauGuyanaHaitiHeavily indebted poor countries (HIPC)High incomeHondurasHong Kong SAR, ChinaHungaryIBRD onlyIcelandIDA & IBRD totalIDA blendIDA onlyIDA totalIndiaIndonesiaIran, Islamic Rep.IraqIrelandIsraelItalyJamaicaJapanJordanKazakhstanKenyaKiribatiKorea, Rep.KosovoKuwaitKyrgyz RepublicLao PDRLate-demographic dividendLatin America & Caribbean Latin America & Caribbean (excluding high income)Latin America & the Caribbean (IDA & IBRD countries)LatviaLeast developed countries: UN classificationLebanonLesothoLiberiaLibyaLithuaniaLow & middle incomeLow incomeLower middle incomeLuxembourgMacao SAR, ChinaMacedonia, FYRMadagascarMalawiMalaysiaMaldivesMaliMaltaMarshall IslandsMauritaniaMauritiusMexicoMicronesia, Fed. Sts.Middle East & North AfricaMiddle East & North Africa (excluding high income)Middle East & North Africa (IDA & IBRD countries)Middle incomeMoldovaMongoliaMontenegroMoroccoMozambiqueMyanmarNamibiaNepalNetherlandsNew CaledoniaNew ZealandNicaraguaNigerNigeriaNorth AmericaNorwayOECD membersOmanOther small statesPacific island small statesPakistanPalauPanamaPapua New GuineaParaguayPeruPhilippinesPolandPortugalPost-demographic dividendPre-demographic dividendQatarRomaniaRussian FederationRwandaSamoaSao Tome and PrincipeSaudi ArabiaSenegalSerbiaSeychellesSierra LeoneSingaporeSint Maarten (Dutch part)Slovak RepublicSloveniaSmall statesSolomon IslandsSouth AfricaSouth AsiaSouth Asia (IDA & IBRD)South SudanSpainSri LankaSt. Kitts and NevisSt. LuciaSt. Vincent and the GrenadinesSub-Saharan Africa Sub-Saharan Africa (excluding high income)Sub-Saharan Africa (IDA & IBRD countries)SudanSurinameSwazilandSwedenSwitzerlandSyrian Arab RepublicTajikistanTanzaniaThailandTimor-LesteTogoTongaTrinidad and TobagoTunisiaTurkeyTuvaluUgandaUkraineUnited KingdomUnited StatesUpper middle incomeUruguayVanuatuVenezuela, RBVietnamWest Bank and GazaWorldYemen, Rep.ZambiaZimbabwe Timeline:
This timeline shows a graph from 1978 to 2016 of Latin America & the Caribbean (IDA & IBRD countries). No data until 1977. Number of actual observations by date: 39.
Source name:
World Development Indicators
Source organization:
International Monetary Fund, Balance of Payments Statistics Yearbook and data files.
Categories, topics:
Economy & Growth
Last updated:
apr 23, 2017
Indicators value changes by year
Minimum:
8.456 bln
jan 1, 1978
Maximum:
229.795 bln
jan 1, 2012
At the date of observation
Value
Absolute change
Change from previous value
jan 1, 1978
8.456 bln
+8.456 bln
0.0%
jan 1, 1979
11.103 bln
+2.646 bln
31.29%
jan 1, 1980
20.693 bln
+9.591 bln
86.38%
jan 1, 1981
32.144 bln
+11.451 bln
55.34%
jan 1, 1982
45.124 bln
+12.98 bln
40.38%
jan 1, 1983
53.386 bln
+8.261 bln
18.31%
jan 1, 1984
44.992 bln
-8.394 bln
-15.72%
jan 1, 1985
49.27 bln
+4.278 bln
9.51%
jan 1, 1986
46.549 bln
-2.721 bln
-5.52%
jan 1, 1987
41.95 bln
-4.6 bln
-9.88%
jan 1, 1988
39.512 bln
-2.438 bln
-5.81%
jan 1, 1989
43.044 bln
+3.532 bln
8.94%
jan 1, 1990
48.665 bln
+5.621 bln
13.06%
jan 1, 1991
47.141 bln
-1.524 bln
-3.13%
jan 1, 1992
43.897 bln
-3.245 bln
-6.88%
jan 1, 1993
42.051 bln
-1.846 bln
-4.21%
jan 1, 1994
46.726 bln
+4.676 bln
11.12%
jan 1, 1995
51.564 bln
+4.837 bln
10.35%
jan 1, 1996
61.248 bln
+9.684 bln
18.78%
jan 1, 1997
64.57 bln
+3.322 bln
5.42%
jan 1, 1998
72.97 bln
+8.4 bln
13.01%
jan 1, 1999
77.877 bln
+4.907 bln
6.72%
jan 1, 2000
74.968 bln
-2.909 bln
-3.73%
jan 1, 2001
82.059 bln
+7.091 bln
9.46%
jan 1, 2002
79.278 bln
-2.78 bln
-3.39%
jan 1, 2003
71.287 bln
-7.992 bln
-10.08%
jan 1, 2004
77.305 bln
+6.018 bln
8.44%
jan 1, 2005
90.259 bln
+12.954 bln
16.76%
jan 1, 2006
108.756 bln
+18.498 bln
20.49%
jan 1, 2007
134.998 bln
+26.242 bln
24.13%
jan 1, 2008
157.353 bln
+22.355 bln
16.56%
jan 1, 2009
164.577 bln
+7.225 bln
4.59%
jan 1, 2010
139.057 bln
-25.52 bln
-15.51%
jan 1, 2011
199.157 bln
+60.1 bln
43.22%
jan 1, 2012
229.795 bln
+30.638 bln
15.38%
jan 1, 2013
202.791 bln
-27.004 bln
-11.75%
jan 1, 2014
194.383 bln
-8.408 bln
-4.15%
jan 1, 2015
201.103 bln
+6.72 bln
3.46%
jan 1, 2016
175.205 bln
-25.899 bln
-12.88%
Ranking of countries by current statistics by years


Comments: