29
/
en
AIzaSyAYiBZKx7MnpbEhh9jyipgxe19OcubqV5w
April 1, 2024
91775
Brazil
BRA
true
2
1
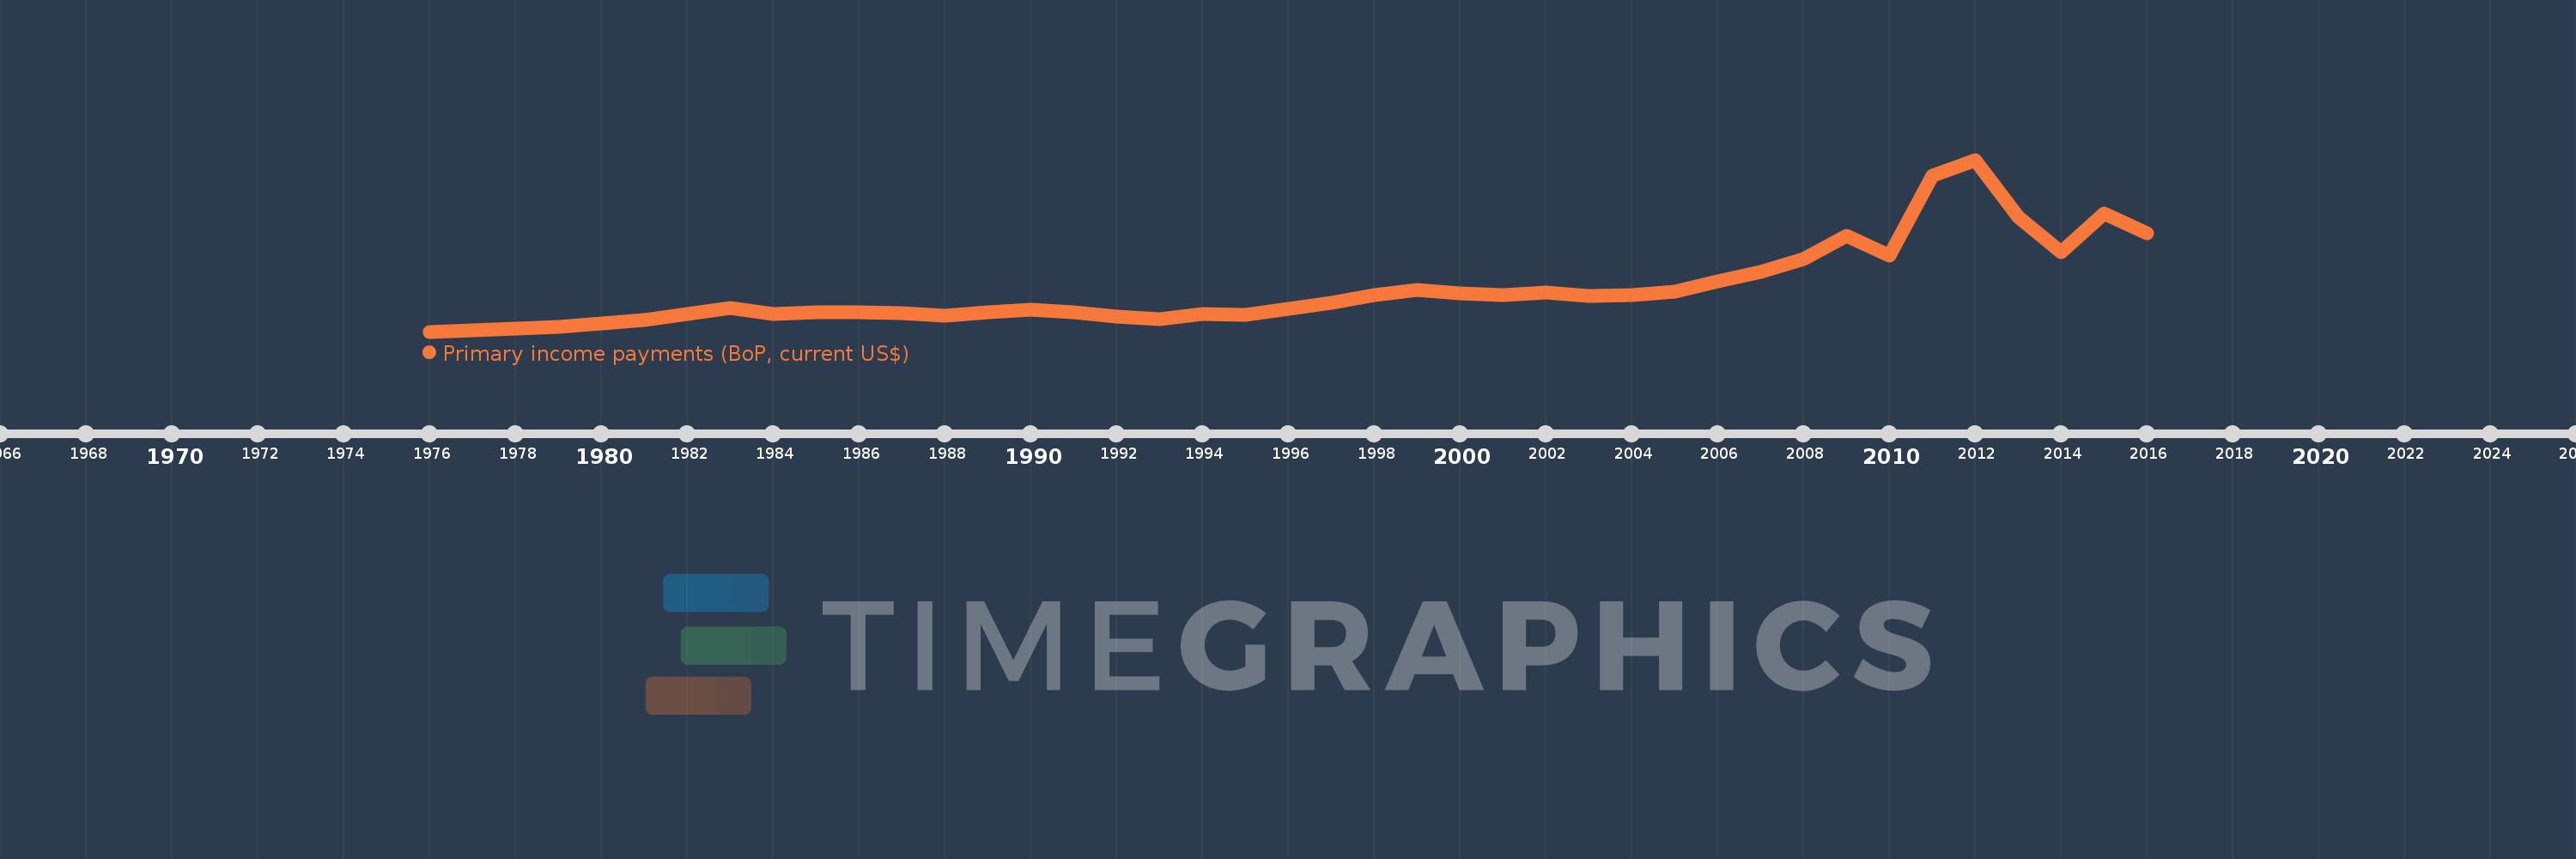
Primary income payments (BoP, current US$)
2016,2015,2014,2013,2012,2011,2010,2009,2008,2007,2006,2005,2004,2003,2002,2001,2000,1999,1998,1997,1996,1995,1994,1993,1992,1991,1990,1989,1988,1987,1986,1985,1984,1983,1982,1981,1980,1979,1978,1977,1976
This statistics in other country:
AfghanistanAlbaniaAlgeriaAngolaAntigua and BarbudaArab WorldArgentinaArmeniaArubaAustraliaAustriaAzerbaijanBahamas, TheBahrainBangladeshBarbadosBelarusBelgiumBelizeBeninBermudaBhutanBoliviaBosnia and HerzegovinaBotswanaBrazilBrunei DarussalamBulgariaBurkina FasoBurundiCabo VerdeCambodiaCameroonCanadaCaribbean small statesCentral African RepublicCentral Europe and the BalticsChadChileChinaColombiaComorosCongo, Dem. Rep.Congo, Rep.Costa RicaCote d'IvoireCroatiaCuracaoCyprusCzech RepublicDenmarkDjiboutiDominicaDominican RepublicEarly-demographic dividendEast Asia & PacificEast Asia & Pacific (excluding high income)East Asia & Pacific (IDA & IBRD countries)EcuadorEgypt, Arab Rep.El SalvadorEquatorial GuineaEritreaEstoniaEthiopiaEuro areaEurope & Central AsiaEurope & Central Asia (excluding high income)Europe & Central Asia (IDA & IBRD countries)European UnionFaroe IslandsFijiFinlandFragile and conflict affected situationsFranceFrench PolynesiaGabonGambia, TheGeorgiaGermanyGhanaGreeceGrenadaGuatemalaGuineaGuinea-BissauGuyanaHaitiHeavily indebted poor countries (HIPC)High incomeHondurasHong Kong SAR, ChinaHungaryIBRD onlyIcelandIDA & IBRD totalIDA blendIDA onlyIDA totalIndiaIndonesiaIran, Islamic Rep.IraqIrelandIsraelItalyJamaicaJapanJordanKazakhstanKenyaKiribatiKorea, Rep.KosovoKuwaitKyrgyz RepublicLao PDRLate-demographic dividendLatin America & Caribbean Latin America & Caribbean (excluding high income)Latin America & the Caribbean (IDA & IBRD countries)LatviaLeast developed countries: UN classificationLebanonLesothoLiberiaLibyaLithuaniaLow & middle incomeLow incomeLower middle incomeLuxembourgMacao SAR, ChinaMacedonia, FYRMadagascarMalawiMalaysiaMaldivesMaliMaltaMarshall IslandsMauritaniaMauritiusMexicoMicronesia, Fed. Sts.Middle East & North AfricaMiddle East & North Africa (excluding high income)Middle East & North Africa (IDA & IBRD countries)Middle incomeMoldovaMongoliaMontenegroMoroccoMozambiqueMyanmarNamibiaNepalNetherlandsNew CaledoniaNew ZealandNicaraguaNigerNigeriaNorth AmericaNorwayOECD membersOmanOther small statesPacific island small statesPakistanPalauPanamaPapua New GuineaParaguayPeruPhilippinesPolandPortugalPost-demographic dividendPre-demographic dividendQatarRomaniaRussian FederationRwandaSamoaSao Tome and PrincipeSaudi ArabiaSenegalSerbiaSeychellesSierra LeoneSingaporeSint Maarten (Dutch part)Slovak RepublicSloveniaSmall statesSolomon IslandsSouth AfricaSouth AsiaSouth Asia (IDA & IBRD)South SudanSpainSri LankaSt. Kitts and NevisSt. LuciaSt. Vincent and the GrenadinesSub-Saharan Africa Sub-Saharan Africa (excluding high income)Sub-Saharan Africa (IDA & IBRD countries)SudanSurinameSwazilandSwedenSwitzerlandSyrian Arab RepublicTajikistanTanzaniaThailandTimor-LesteTogoTongaTrinidad and TobagoTunisiaTurkeyTuvaluUgandaUkraineUnited KingdomUnited StatesUpper middle incomeUruguayVanuatuVenezuela, RBVietnamWest Bank and GazaWorldYemen, Rep.ZambiaZimbabwe Timeline:
This timeline shows a graph from 1976 to 2016 of Brazil. No data until 1975. Number of actual observations by date: 41.
Source name:
World Development Indicators
Source organization:
International Monetary Fund, Balance of Payments Statistics Yearbook and data files.
Categories, topics:
Economy & Growth
Last updated:
apr 23, 2017
Indicators value changes by year
Minimum:
2.404 bln
jan 1, 1976
Maximum:
93.357 bln
jan 1, 2012
At the date of observation
Value
Absolute change
Change from previous value
jan 1, 1976
2.404 bln
+2.404 bln
0.0%
jan 1, 1977
2.891 bln
+487.0 mln
20.26%
jan 1, 1978
3.806 bln
+915.0 mln
31.65%
jan 1, 1979
4.892 bln
+1.086 bln
28.53%
jan 1, 1980
6.733 bln
+1.841 bln
37.63%
jan 1, 1981
8.424 bln
+1.691 bln
25.12%
jan 1, 1982
11.644 bln
+3.22 bln
38.22%
jan 1, 1983
14.981 bln
+3.337 bln
28.66%
jan 1, 1984
11.726 bln
-3.255 bln
-21.73%
jan 1, 1985
12.722 bln
+996.0 mln
8.49%
jan 1, 1986
12.779 bln
+57.0 mln
0.45%
jan 1, 1987
12.089 bln
-690.0 mln
-5.4%
jan 1, 1988
10.882 bln
-1.207 bln
-9.98%
jan 1, 1989
12.851 bln
+1.969 bln
18.09%
jan 1, 1990
13.856 bln
+1.005 bln
7.82%
jan 1, 1991
12.765 bln
-1.091 bln
-7.87%
jan 1, 1992
10.555 bln
-2.21 bln
-17.31%
jan 1, 1993
9.115 bln
-1.44 bln
-13.64%
jan 1, 1994
11.63 bln
+2.515 bln
27.59%
jan 1, 1995
11.293 bln
-337.0 mln
-2.9%
jan 1, 1996
14.562 bln
+3.269 bln
28.95%
jan 1, 1997
17.527 bln
+2.965 bln
20.36%
jan 1, 1998
21.688 bln
+4.161 bln
23.74%
jan 1, 1999
24.531 bln
+2.843 bln
13.11%
jan 1, 2000
22.78 bln
-1.751 bln
-7.14%
jan 1, 2001
21.507 bln
-1.273 bln
-5.59%
jan 1, 2002
23.023 bln
+1.516 bln
7.05%
jan 1, 2003
21.486 bln
-1.537 bln
-6.68%
jan 1, 2004
21.891 bln
+404.976 mln
1.88%
jan 1, 2005
23.719 bln
+1.828 bln
8.35%
jan 1, 2006
29.162 bln
+5.443 bln
22.95%
jan 1, 2007
33.927 bln
+4.765 bln
16.34%
jan 1, 2008
40.784 bln
+6.857 bln
20.21%
jan 1, 2009
53.073 bln
+12.289 bln
30.13%
jan 1, 2010
42.51 bln
-10.563 bln
-19.9%
jan 1, 2011
84.751 bln
+42.241 bln
99.37%
jan 1, 2012
93.357 bln
+8.606 bln
10.15%
jan 1, 2013
62.926 bln
-30.431 bln
-32.6%
jan 1, 2014
44.668 bln
-18.257 bln
-29.01%
jan 1, 2015
65.02 bln
+20.351 bln
45.56%
jan 1, 2016
54.288 bln
-10.732 bln
-16.51%
Ranking of countries by current statistics by years


Comments: