29
/
en
AIzaSyAYiBZKx7MnpbEhh9jyipgxe19OcubqV5w
April 1, 2024
246213
South Africa
ZAF
true
2
1
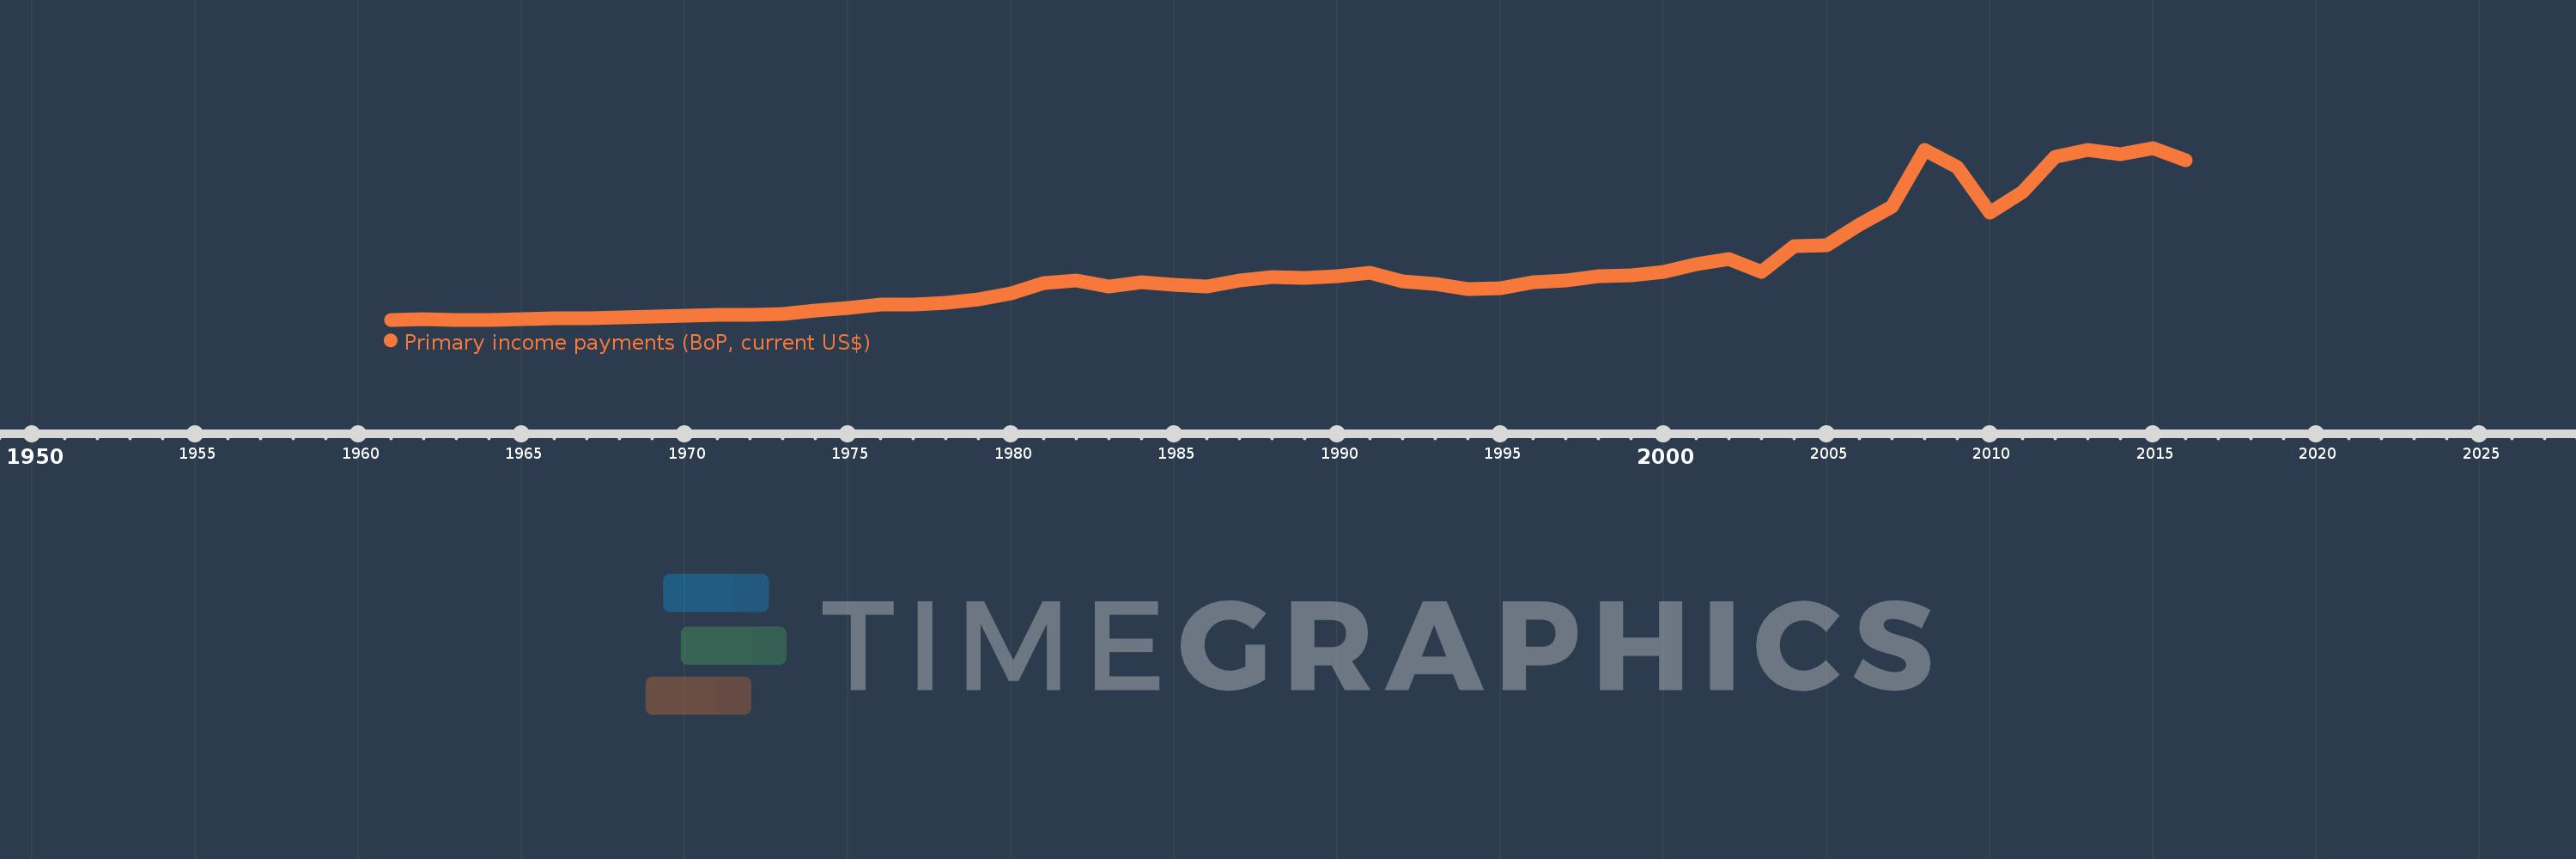
Primary income payments (BoP, current US$)
2016,2015,2014,2013,2012,2011,2010,2009,2008,2007,2006,2005,2004,2003,2002,2001,2000,1999,1998,1997,1996,1995,1994,1993,1992,1991,1990,1989,1988,1987,1986,1985,1984,1983,1982,1981,1980,1979,1978,1977,1976,1975,1974,1973,1972,1971,1970,1969,1968,1967,1966,1965,1964,1963,1962,1961
This statistics in other country:
AfghanistanAlbaniaAlgeriaAngolaAntigua and BarbudaArab WorldArgentinaArmeniaArubaAustraliaAustriaAzerbaijanBahamas, TheBahrainBangladeshBarbadosBelarusBelgiumBelizeBeninBermudaBhutanBoliviaBosnia and HerzegovinaBotswanaBrazilBrunei DarussalamBulgariaBurkina FasoBurundiCabo VerdeCambodiaCameroonCanadaCaribbean small statesCentral African RepublicCentral Europe and the BalticsChadChileChinaColombiaComorosCongo, Dem. Rep.Congo, Rep.Costa RicaCote d'IvoireCroatiaCuracaoCyprusCzech RepublicDenmarkDjiboutiDominicaDominican RepublicEarly-demographic dividendEast Asia & PacificEast Asia & Pacific (excluding high income)East Asia & Pacific (IDA & IBRD countries)EcuadorEgypt, Arab Rep.El SalvadorEquatorial GuineaEritreaEstoniaEthiopiaEuro areaEurope & Central AsiaEurope & Central Asia (excluding high income)Europe & Central Asia (IDA & IBRD countries)European UnionFaroe IslandsFijiFinlandFragile and conflict affected situationsFranceFrench PolynesiaGabonGambia, TheGeorgiaGermanyGhanaGreeceGrenadaGuatemalaGuineaGuinea-BissauGuyanaHaitiHeavily indebted poor countries (HIPC)High incomeHondurasHong Kong SAR, ChinaHungaryIBRD onlyIcelandIDA & IBRD totalIDA blendIDA onlyIDA totalIndiaIndonesiaIran, Islamic Rep.IraqIrelandIsraelItalyJamaicaJapanJordanKazakhstanKenyaKiribatiKorea, Rep.KosovoKuwaitKyrgyz RepublicLao PDRLate-demographic dividendLatin America & Caribbean Latin America & Caribbean (excluding high income)Latin America & the Caribbean (IDA & IBRD countries)LatviaLeast developed countries: UN classificationLebanonLesothoLiberiaLibyaLithuaniaLow & middle incomeLow incomeLower middle incomeLuxembourgMacao SAR, ChinaMacedonia, FYRMadagascarMalawiMalaysiaMaldivesMaliMaltaMarshall IslandsMauritaniaMauritiusMexicoMicronesia, Fed. Sts.Middle East & North AfricaMiddle East & North Africa (excluding high income)Middle East & North Africa (IDA & IBRD countries)Middle incomeMoldovaMongoliaMontenegroMoroccoMozambiqueMyanmarNamibiaNepalNetherlandsNew CaledoniaNew ZealandNicaraguaNigerNigeriaNorth AmericaNorwayOECD membersOmanOther small statesPacific island small statesPakistanPalauPanamaPapua New GuineaParaguayPeruPhilippinesPolandPortugalPost-demographic dividendPre-demographic dividendQatarRomaniaRussian FederationRwandaSamoaSao Tome and PrincipeSaudi ArabiaSenegalSerbiaSeychellesSierra LeoneSingaporeSint Maarten (Dutch part)Slovak RepublicSloveniaSmall statesSolomon IslandsSouth AfricaSouth AsiaSouth Asia (IDA & IBRD)South SudanSpainSri LankaSt. Kitts and NevisSt. LuciaSt. Vincent and the GrenadinesSub-Saharan Africa Sub-Saharan Africa (excluding high income)Sub-Saharan Africa (IDA & IBRD countries)SudanSurinameSwazilandSwedenSwitzerlandSyrian Arab RepublicTajikistanTanzaniaThailandTimor-LesteTogoTongaTrinidad and TobagoTunisiaTurkeyTuvaluUgandaUkraineUnited KingdomUnited StatesUpper middle incomeUruguayVanuatuVenezuela, RBVietnamWest Bank and GazaWorldYemen, Rep.ZambiaZimbabwe Timeline:
This timeline shows a graph from 1961 to 2016 of South Africa. No data until 1960. Number of actual observations by date: 56.
Source name:
World Development Indicators
Source organization:
International Monetary Fund, Balance of Payments Statistics Yearbook and data files.
Categories, topics:
Economy & Growth
Last updated:
apr 23, 2017
Indicators value changes by year
Minimum:
386.4 mln
jan 1, 1964
Maximum:
16.92 bln
jan 1, 2015
At the date of observation
Value
Absolute change
Change from previous value
jan 1, 1961
396.2 mln
+396.2 mln
0.0%
jan 1, 1962
436.8 mln
+40.6 mln
10.25%
jan 1, 1963
397.6 mln
-39.2 mln
-8.97%
jan 1, 1964
386.4 mln
-11.2 mln
-2.82%
jan 1, 1965
459.2 mln
+72.8 mln
18.84%
jan 1, 1966
504.0 mln
+44.8 mln
9.76%
jan 1, 1967
544.6 mln
+40.6 mln
8.06%
jan 1, 1968
592.2 mln
+47.6 mln
8.74%
jan 1, 1969
666.4 mln
+74.2 mln
12.53%
jan 1, 1970
774.2 mln
+107.8 mln
16.18%
jan 1, 1971
840.0 mln
+65.8 mln
8.5%
jan 1, 1972
858.358 mln
+18.358 mln
2.19%
jan 1, 1973
913.64 mln
+55.282 mln
6.44%
jan 1, 1974
1.308 bln
+393.925 mln
43.12%
jan 1, 1975
1.552 bln
+244.868 mln
18.73%
jan 1, 1976
1.859 bln
+306.601 mln
19.75%
jan 1, 1977
1.868 bln
+8.567 mln
0.46%
jan 1, 1978
2.002 bln
+134.55 mln
7.2%
jan 1, 1979
2.349 bln
+347.3 mln
17.35%
jan 1, 1980
2.916 bln
+566.574 mln
24.12%
jan 1, 1981
3.917 bln
+1.001 bln
34.33%
jan 1, 1982
4.127 bln
+209.48 mln
5.35%
jan 1, 1983
3.598 bln
-528.944 mln
-12.82%
jan 1, 1984
4.009 bln
+411.328 mln
11.43%
jan 1, 1985
3.726 bln
-282.909 mln
-7.06%
jan 1, 1986
3.569 bln
-156.729 mln
-4.21%
jan 1, 1987
4.146 bln
+576.526 mln
16.15%
jan 1, 1988
4.473 bln
+327.378 mln
7.9%
jan 1, 1989
4.419 bln
-53.77 mln
-1.2%
jan 1, 1990
4.568 bln
+148.504 mln
3.36%
jan 1, 1991
4.928 bln
+360.408 mln
7.89%
jan 1, 1992
4.084 bln
-844.525 mln
-17.14%
jan 1, 1993
3.871 bln
-212.649 mln
-5.21%
jan 1, 1994
3.352 bln
-518.717 mln
-13.4%
jan 1, 1995
3.394 bln
+41.99 mln
1.25%
jan 1, 1996
4.011 bln
+616.46 mln
18.16%
jan 1, 1997
4.194 bln
+183.327 mln
4.57%
jan 1, 1998
4.612 bln
+417.813 mln
9.96%
jan 1, 1999
4.659 bln
+47.322 mln
1.03%
jan 1, 2000
5.0 bln
+340.294 mln
7.3%
jan 1, 2001
5.696 bln
+696.007 mln
13.92%
jan 1, 2002
6.267 bln
+570.943 mln
10.02%
jan 1, 2003
4.975 bln
-1.291 bln
-20.61%
jan 1, 2004
7.449 bln
+2.473 bln
49.71%
jan 1, 2005
7.576 bln
+127.973 mln
1.72%
jan 1, 2006
9.569 bln
+1.993 bln
26.3%
jan 1, 2007
11.237 bln
+1.667 bln
17.42%
jan 1, 2008
16.725 bln
+5.489 bln
48.85%
jan 1, 2009
15.076 bln
-1.649 bln
-9.86%
jan 1, 2010
10.688 bln
-4.388 bln
-29.11%
jan 1, 2011
12.647 bln
+1.959 bln
18.33%
jan 1, 2012
16.092 bln
+3.445 bln
27.24%
jan 1, 2013
16.734 bln
+641.476 mln
3.99%
jan 1, 2014
16.341 bln
-393.102 mln
-2.35%
jan 1, 2015
16.92 bln
+579.092 mln
3.54%
jan 1, 2016
15.702 bln
-1.217 bln
-7.2%
Ranking of countries by current statistics by years


Comments: