29
/
en
AIzaSyAYiBZKx7MnpbEhh9jyipgxe19OcubqV5w
April 1, 2024
109031
Comoros
COM
true
2
1
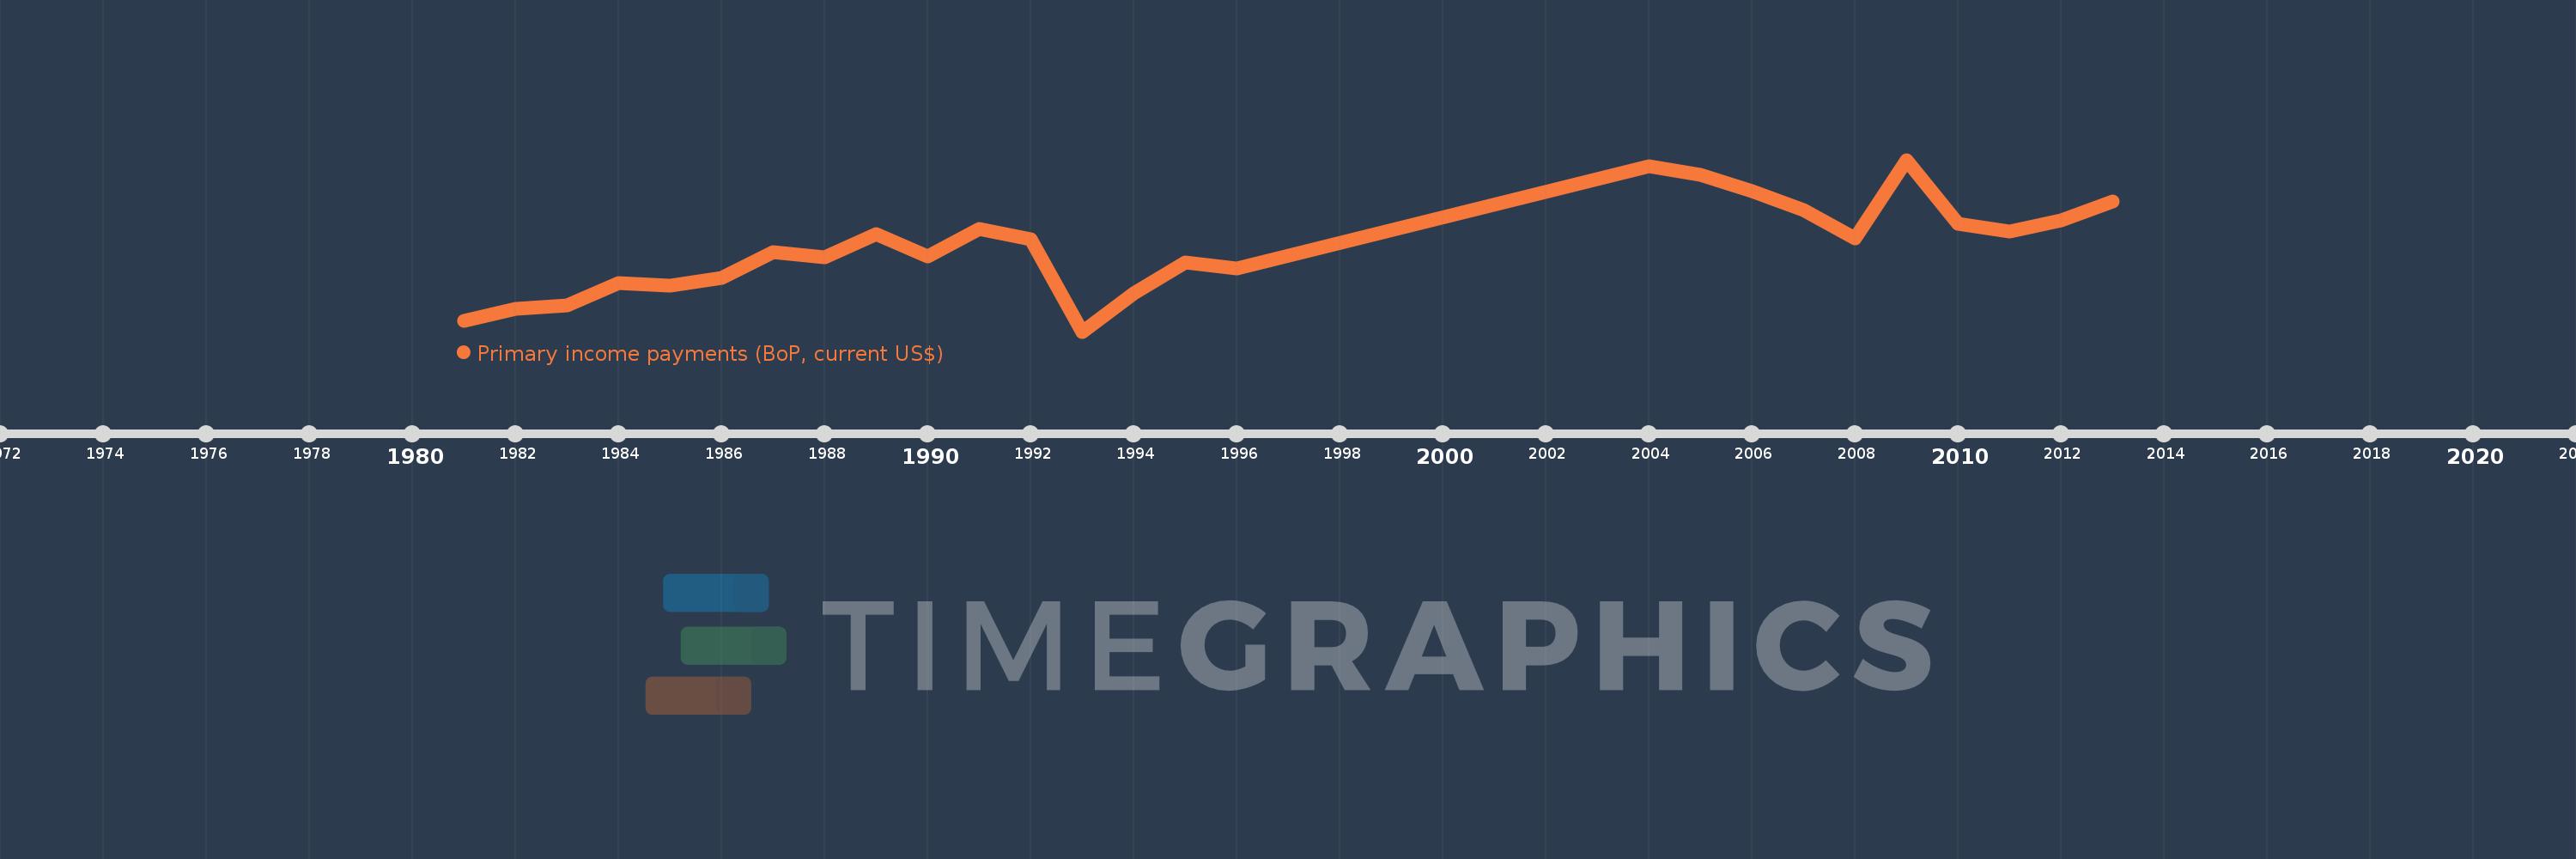
Primary income payments (BoP, current US$)
2013,2012,2011,2010,2009,2008,2007,2006,2005,2004,1996,1995,1994,1993,1992,1991,1990,1989,1988,1987,1986,1985,1984,1983,1982,1981
This statistics in other country:
AfghanistanAlbaniaAlgeriaAngolaAntigua and BarbudaArab WorldArgentinaArmeniaArubaAustraliaAustriaAzerbaijanBahamas, TheBahrainBangladeshBarbadosBelarusBelgiumBelizeBeninBermudaBhutanBoliviaBosnia and HerzegovinaBotswanaBrazilBrunei DarussalamBulgariaBurkina FasoBurundiCabo VerdeCambodiaCameroonCanadaCaribbean small statesCentral African RepublicCentral Europe and the BalticsChadChileChinaColombiaComorosCongo, Dem. Rep.Congo, Rep.Costa RicaCote d'IvoireCroatiaCuracaoCyprusCzech RepublicDenmarkDjiboutiDominicaDominican RepublicEarly-demographic dividendEast Asia & PacificEast Asia & Pacific (excluding high income)East Asia & Pacific (IDA & IBRD countries)EcuadorEgypt, Arab Rep.El SalvadorEquatorial GuineaEritreaEstoniaEthiopiaEuro areaEurope & Central AsiaEurope & Central Asia (excluding high income)Europe & Central Asia (IDA & IBRD countries)European UnionFaroe IslandsFijiFinlandFragile and conflict affected situationsFranceFrench PolynesiaGabonGambia, TheGeorgiaGermanyGhanaGreeceGrenadaGuatemalaGuineaGuinea-BissauGuyanaHaitiHeavily indebted poor countries (HIPC)High incomeHondurasHong Kong SAR, ChinaHungaryIBRD onlyIcelandIDA & IBRD totalIDA blendIDA onlyIDA totalIndiaIndonesiaIran, Islamic Rep.IraqIrelandIsraelItalyJamaicaJapanJordanKazakhstanKenyaKiribatiKorea, Rep.KosovoKuwaitKyrgyz RepublicLao PDRLate-demographic dividendLatin America & Caribbean Latin America & Caribbean (excluding high income)Latin America & the Caribbean (IDA & IBRD countries)LatviaLeast developed countries: UN classificationLebanonLesothoLiberiaLibyaLithuaniaLow & middle incomeLow incomeLower middle incomeLuxembourgMacao SAR, ChinaMacedonia, FYRMadagascarMalawiMalaysiaMaldivesMaliMaltaMarshall IslandsMauritaniaMauritiusMexicoMicronesia, Fed. Sts.Middle East & North AfricaMiddle East & North Africa (excluding high income)Middle East & North Africa (IDA & IBRD countries)Middle incomeMoldovaMongoliaMontenegroMoroccoMozambiqueMyanmarNamibiaNepalNetherlandsNew CaledoniaNew ZealandNicaraguaNigerNigeriaNorth AmericaNorwayOECD membersOmanOther small statesPacific island small statesPakistanPalauPanamaPapua New GuineaParaguayPeruPhilippinesPolandPortugalPost-demographic dividendPre-demographic dividendQatarRomaniaRussian FederationRwandaSamoaSao Tome and PrincipeSaudi ArabiaSenegalSerbiaSeychellesSierra LeoneSingaporeSint Maarten (Dutch part)Slovak RepublicSloveniaSmall statesSolomon IslandsSouth AfricaSouth AsiaSouth Asia (IDA & IBRD)South SudanSpainSri LankaSt. Kitts and NevisSt. LuciaSt. Vincent and the GrenadinesSub-Saharan Africa Sub-Saharan Africa (excluding high income)Sub-Saharan Africa (IDA & IBRD countries)SudanSurinameSwazilandSwedenSwitzerlandSyrian Arab RepublicTajikistanTanzaniaThailandTimor-LesteTogoTongaTrinidad and TobagoTunisiaTurkeyTuvaluUgandaUkraineUnited KingdomUnited StatesUpper middle incomeUruguayVanuatuVenezuela, RBVietnamWest Bank and GazaWorldYemen, Rep.ZambiaZimbabwe Timeline:
This timeline shows a graph from 1981 to 2013 of Comoros. No data until 1980. Number of actual observations by date: 26.
Source name:
World Development Indicators
Source organization:
International Monetary Fund, Balance of Payments Statistics Yearbook and data files.
Categories, topics:
Economy & Growth
Last updated:
apr 23, 2017
Indicators value changes by year
Minimum:
-460.917K
jan 1, 1993
Maximum:
7.327 mln
jan 1, 2009
At the date of observation
Value
Absolute change
Change from previous value
jan 1, 1981
42.598K
+42.598K
0.0%
jan 1, 1982
563.061K
+520.463K
1.22K%
jan 1, 1983
712.104K
+149.044K
26.47%
jan 1, 1984
1.729 mln
+1.017 mln
142.85%
jan 1, 1985
1.609 mln
-120.505K
-6.97%
jan 1, 1986
1.965 mln
+356.589K
22.16%
jan 1, 1987
3.133 mln
+1.168 mln
59.41%
jan 1, 1988
2.918 mln
-214.956K
-6.86%
jan 1, 1989
3.945 mln
+1.027 mln
35.19%
jan 1, 1990
2.94 mln
-1.005 mln
-25.47%
jan 1, 1991
4.206 mln
+1.265 mln
43.03%
jan 1, 1992
3.743 mln
-462.207K
-10.99%
jan 1, 1993
-460.917K
-4.204 mln
-112.31%
jan 1, 1994
1.275 mln
+1.736 mln
-376.6%
jan 1, 1995
2.692 mln
+1.417 mln
111.16%
jan 1, 1996
2.391 mln
-301.365K
-11.19%
jan 1, 2004
7.025 mln
+4.634 mln
193.82%
jan 1, 2005
6.65 mln
-374.09K
-5.33%
jan 1, 2006
5.897 mln
-753.098K
-11.32%
jan 1, 2007
5.06 mln
-837.4K
-14.2%
jan 1, 2008
3.767 mln
-1.293 mln
-25.56%
jan 1, 2009
7.327 mln
+3.561 mln
94.53%
jan 1, 2010
4.431 mln
-2.896 mln
-39.53%
jan 1, 2011
4.084 mln
-347.19K
-7.84%
jan 1, 2012
4.576 mln
+491.951K
12.05%
jan 1, 2013
5.453 mln
+877.013K
19.17%
Ranking of countries by current statistics by years


Comments: