29
/
en
AIzaSyAYiBZKx7MnpbEhh9jyipgxe19OcubqV5w
April 1, 2024
212303
Niger
NER
true
2
1
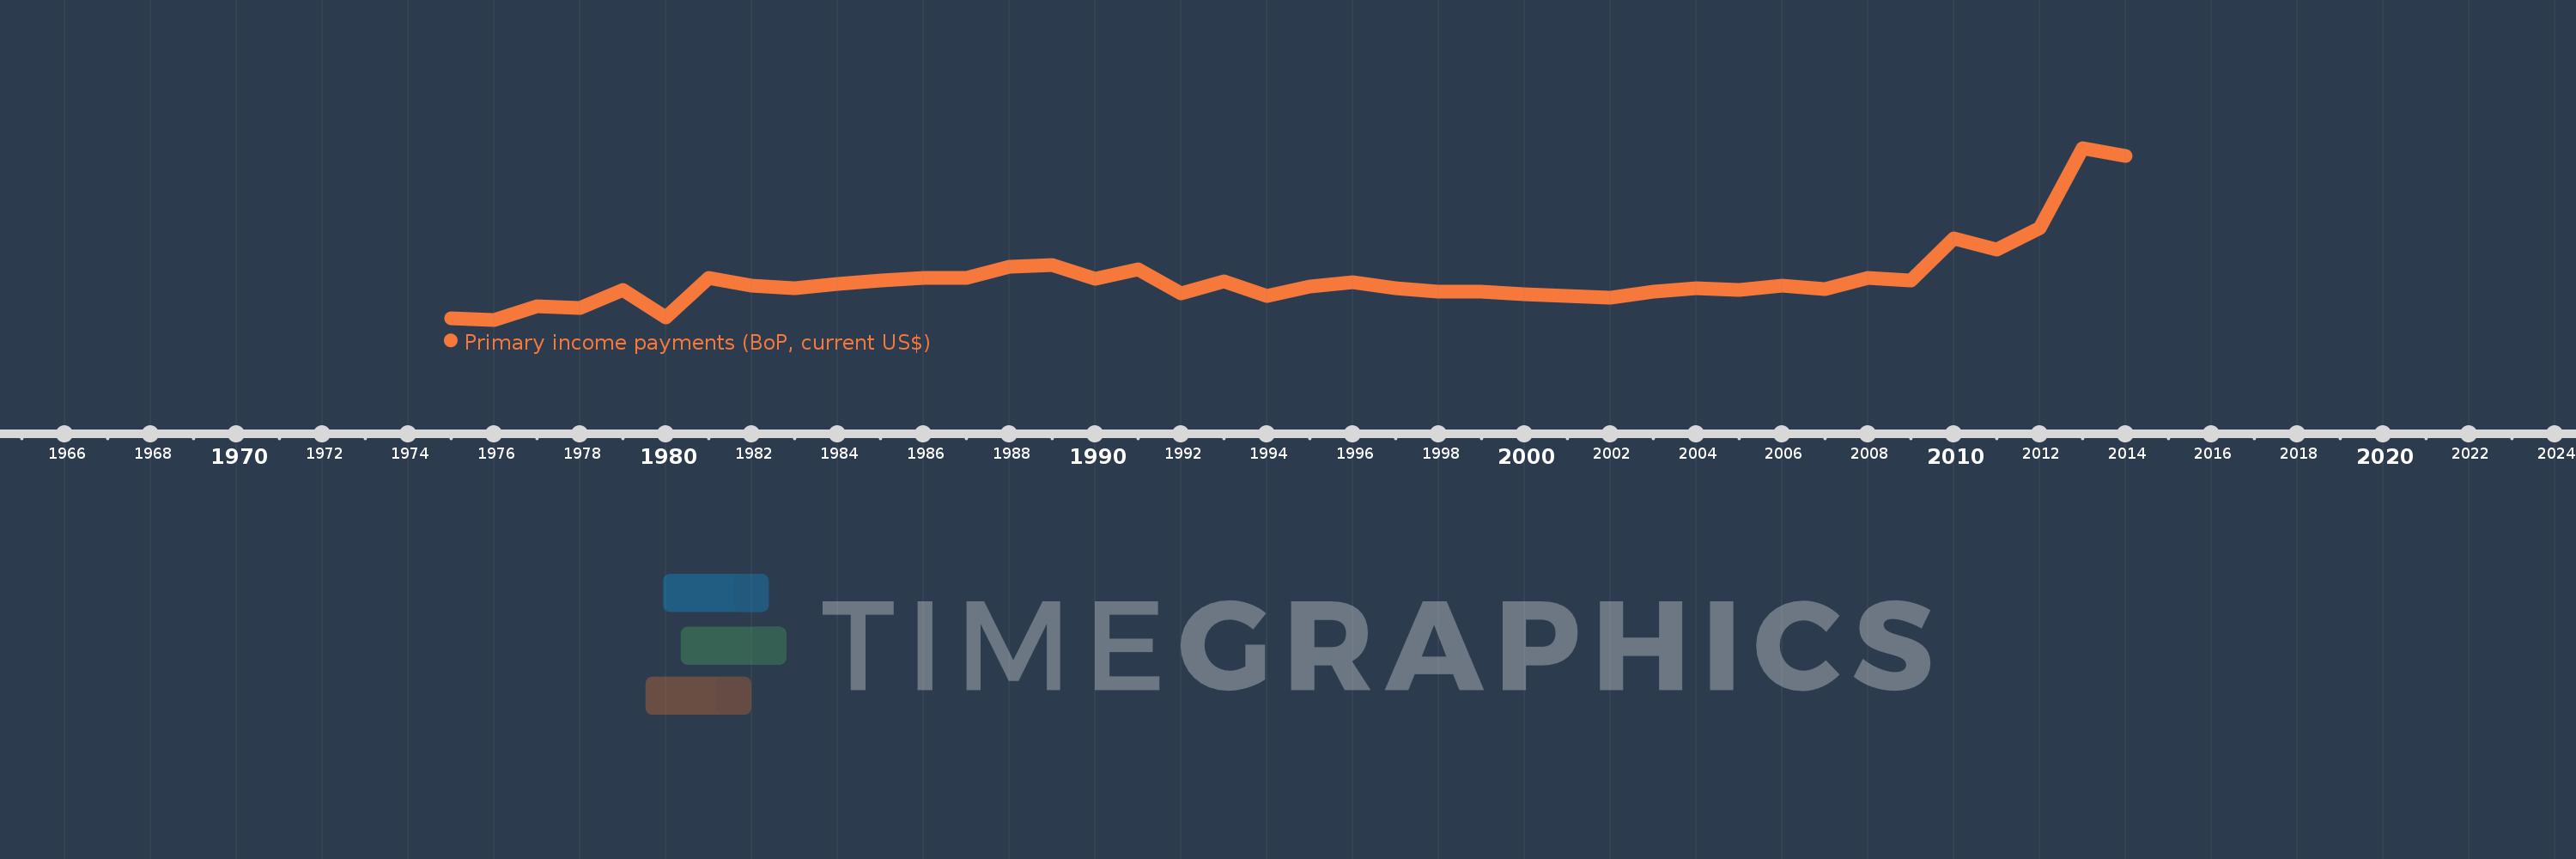
Primary income payments (BoP, current US$)
2014,2013,2012,2011,2010,2009,2008,2007,2006,2005,2004,2003,2002,2001,2000,1999,1998,1997,1996,1995,1994,1993,1992,1991,1990,1989,1988,1987,1986,1985,1984,1983,1982,1981,1980,1979,1978,1977,1976,1975
This statistics in other country:
AfghanistanAlbaniaAlgeriaAngolaAntigua and BarbudaArab WorldArgentinaArmeniaArubaAustraliaAustriaAzerbaijanBahamas, TheBahrainBangladeshBarbadosBelarusBelgiumBelizeBeninBermudaBhutanBoliviaBosnia and HerzegovinaBotswanaBrazilBrunei DarussalamBulgariaBurkina FasoBurundiCabo VerdeCambodiaCameroonCanadaCaribbean small statesCentral African RepublicCentral Europe and the BalticsChadChileChinaColombiaComorosCongo, Dem. Rep.Congo, Rep.Costa RicaCote d'IvoireCroatiaCuracaoCyprusCzech RepublicDenmarkDjiboutiDominicaDominican RepublicEarly-demographic dividendEast Asia & PacificEast Asia & Pacific (excluding high income)East Asia & Pacific (IDA & IBRD countries)EcuadorEgypt, Arab Rep.El SalvadorEquatorial GuineaEritreaEstoniaEthiopiaEuro areaEurope & Central AsiaEurope & Central Asia (excluding high income)Europe & Central Asia (IDA & IBRD countries)European UnionFaroe IslandsFijiFinlandFragile and conflict affected situationsFranceFrench PolynesiaGabonGambia, TheGeorgiaGermanyGhanaGreeceGrenadaGuatemalaGuineaGuinea-BissauGuyanaHaitiHeavily indebted poor countries (HIPC)High incomeHondurasHong Kong SAR, ChinaHungaryIBRD onlyIcelandIDA & IBRD totalIDA blendIDA onlyIDA totalIndiaIndonesiaIran, Islamic Rep.IraqIrelandIsraelItalyJamaicaJapanJordanKazakhstanKenyaKiribatiKorea, Rep.KosovoKuwaitKyrgyz RepublicLao PDRLate-demographic dividendLatin America & Caribbean Latin America & Caribbean (excluding high income)Latin America & the Caribbean (IDA & IBRD countries)LatviaLeast developed countries: UN classificationLebanonLesothoLiberiaLibyaLithuaniaLow & middle incomeLow incomeLower middle incomeLuxembourgMacao SAR, ChinaMacedonia, FYRMadagascarMalawiMalaysiaMaldivesMaliMaltaMarshall IslandsMauritaniaMauritiusMexicoMicronesia, Fed. Sts.Middle East & North AfricaMiddle East & North Africa (excluding high income)Middle East & North Africa (IDA & IBRD countries)Middle incomeMoldovaMongoliaMontenegroMoroccoMozambiqueMyanmarNamibiaNepalNetherlandsNew CaledoniaNew ZealandNicaraguaNigerNigeriaNorth AmericaNorwayOECD membersOmanOther small statesPacific island small statesPakistanPalauPanamaPapua New GuineaParaguayPeruPhilippinesPolandPortugalPost-demographic dividendPre-demographic dividendQatarRomaniaRussian FederationRwandaSamoaSao Tome and PrincipeSaudi ArabiaSenegalSerbiaSeychellesSierra LeoneSingaporeSint Maarten (Dutch part)Slovak RepublicSloveniaSmall statesSolomon IslandsSouth AfricaSouth AsiaSouth Asia (IDA & IBRD)South SudanSpainSri LankaSt. Kitts and NevisSt. LuciaSt. Vincent and the GrenadinesSub-Saharan Africa Sub-Saharan Africa (excluding high income)Sub-Saharan Africa (IDA & IBRD countries)SudanSurinameSwazilandSwedenSwitzerlandSyrian Arab RepublicTajikistanTanzaniaThailandTimor-LesteTogoTongaTrinidad and TobagoTunisiaTurkeyTuvaluUgandaUkraineUnited KingdomUnited StatesUpper middle incomeUruguayVanuatuVenezuela, RBVietnamWest Bank and GazaWorldYemen, Rep.ZambiaZimbabwe Timeline:
This timeline shows a graph from 1975 to 2014 of Niger. No data until 1974. Number of actual observations by date: 40.
Source name:
World Development Indicators
Source organization:
International Monetary Fund, Balance of Payments Statistics Yearbook and data files.
Categories, topics:
Economy & Growth
Last updated:
apr 23, 2017
Indicators value changes by year
Minimum:
-11.133 mln
jan 1, 1976
Maximum:
282.315 mln
jan 1, 2013
At the date of observation
Value
Absolute change
Change from previous value
jan 1, 1975
-8.18 mln
-8.18 mln
0.0%
jan 1, 1976
-11.133 mln
-2.953 mln
36.1%
jan 1, 1977
11.848 mln
+22.981 mln
-206.42%
jan 1, 1978
9.146 mln
-2.702 mln
-22.8%
jan 1, 1979
39.099 mln
+29.953 mln
327.5%
jan 1, 1980
-7.371 mln
-46.47 mln
-118.85%
jan 1, 1981
59.935 mln
+67.306 mln
-913.1%
jan 1, 1982
46.925 mln
-13.01 mln
-21.71%
jan 1, 1983
42.139 mln
-4.786 mln
-10.2%
jan 1, 1984
50.6 mln
+8.462 mln
20.08%
jan 1, 1985
55.225 mln
+4.625 mln
9.14%
jan 1, 1986
60.664 mln
+5.439 mln
9.85%
jan 1, 1987
60.057 mln
-607.074K
-1.0%
jan 1, 1988
79.128 mln
+19.072 mln
31.76%
jan 1, 1989
82.374 mln
+3.246 mln
4.1%
jan 1, 1990
58.973 mln
-23.401 mln
-28.41%
jan 1, 1991
74.417 mln
+15.443 mln
26.19%
jan 1, 1992
33.65 mln
-40.766 mln
-54.78%
jan 1, 1993
54.074 mln
+20.424 mln
60.69%
jan 1, 1994
30.209 mln
-23.865 mln
-44.13%
jan 1, 1995
45.156 mln
+14.948 mln
49.48%
jan 1, 1996
52.904 mln
+7.748 mln
17.16%
jan 1, 1997
43.311 mln
-9.593 mln
-18.13%
jan 1, 1998
36.154 mln
-7.157 mln
-16.53%
jan 1, 1999
36.43 mln
+276.066K
0.76%
jan 1, 2000
32.893 mln
-3.537 mln
-9.71%
jan 1, 2001
29.547 mln
-3.345 mln
-10.17%
jan 1, 2002
27.2 mln
-2.347 mln
-7.94%
jan 1, 2003
37.414 mln
+10.213 mln
37.55%
jan 1, 2004
43.384 mln
+5.971 mln
15.96%
jan 1, 2005
39.365 mln
-4.019 mln
-9.26%
jan 1, 2006
46.566 mln
+7.201 mln
18.29%
jan 1, 2007
40.771 mln
-5.794 mln
-12.44%
jan 1, 2008
59.626 mln
+18.855 mln
46.25%
jan 1, 2009
55.618 mln
-4.009 mln
-6.72%
jan 1, 2010
127.748 mln
+72.13 mln
129.69%
jan 1, 2011
108.852 mln
-18.896 mln
-14.79%
jan 1, 2012
144.804 mln
+35.952 mln
33.03%
jan 1, 2013
282.315 mln
+137.511 mln
94.96%
jan 1, 2014
268.644 mln
-13.671 mln
-4.84%
Ranking of countries by current statistics by years


Comments: