29
/
en
AIzaSyAYiBZKx7MnpbEhh9jyipgxe19OcubqV5w
April 1, 2024
147375
Guinea-Bissau
GNB
true
2
1
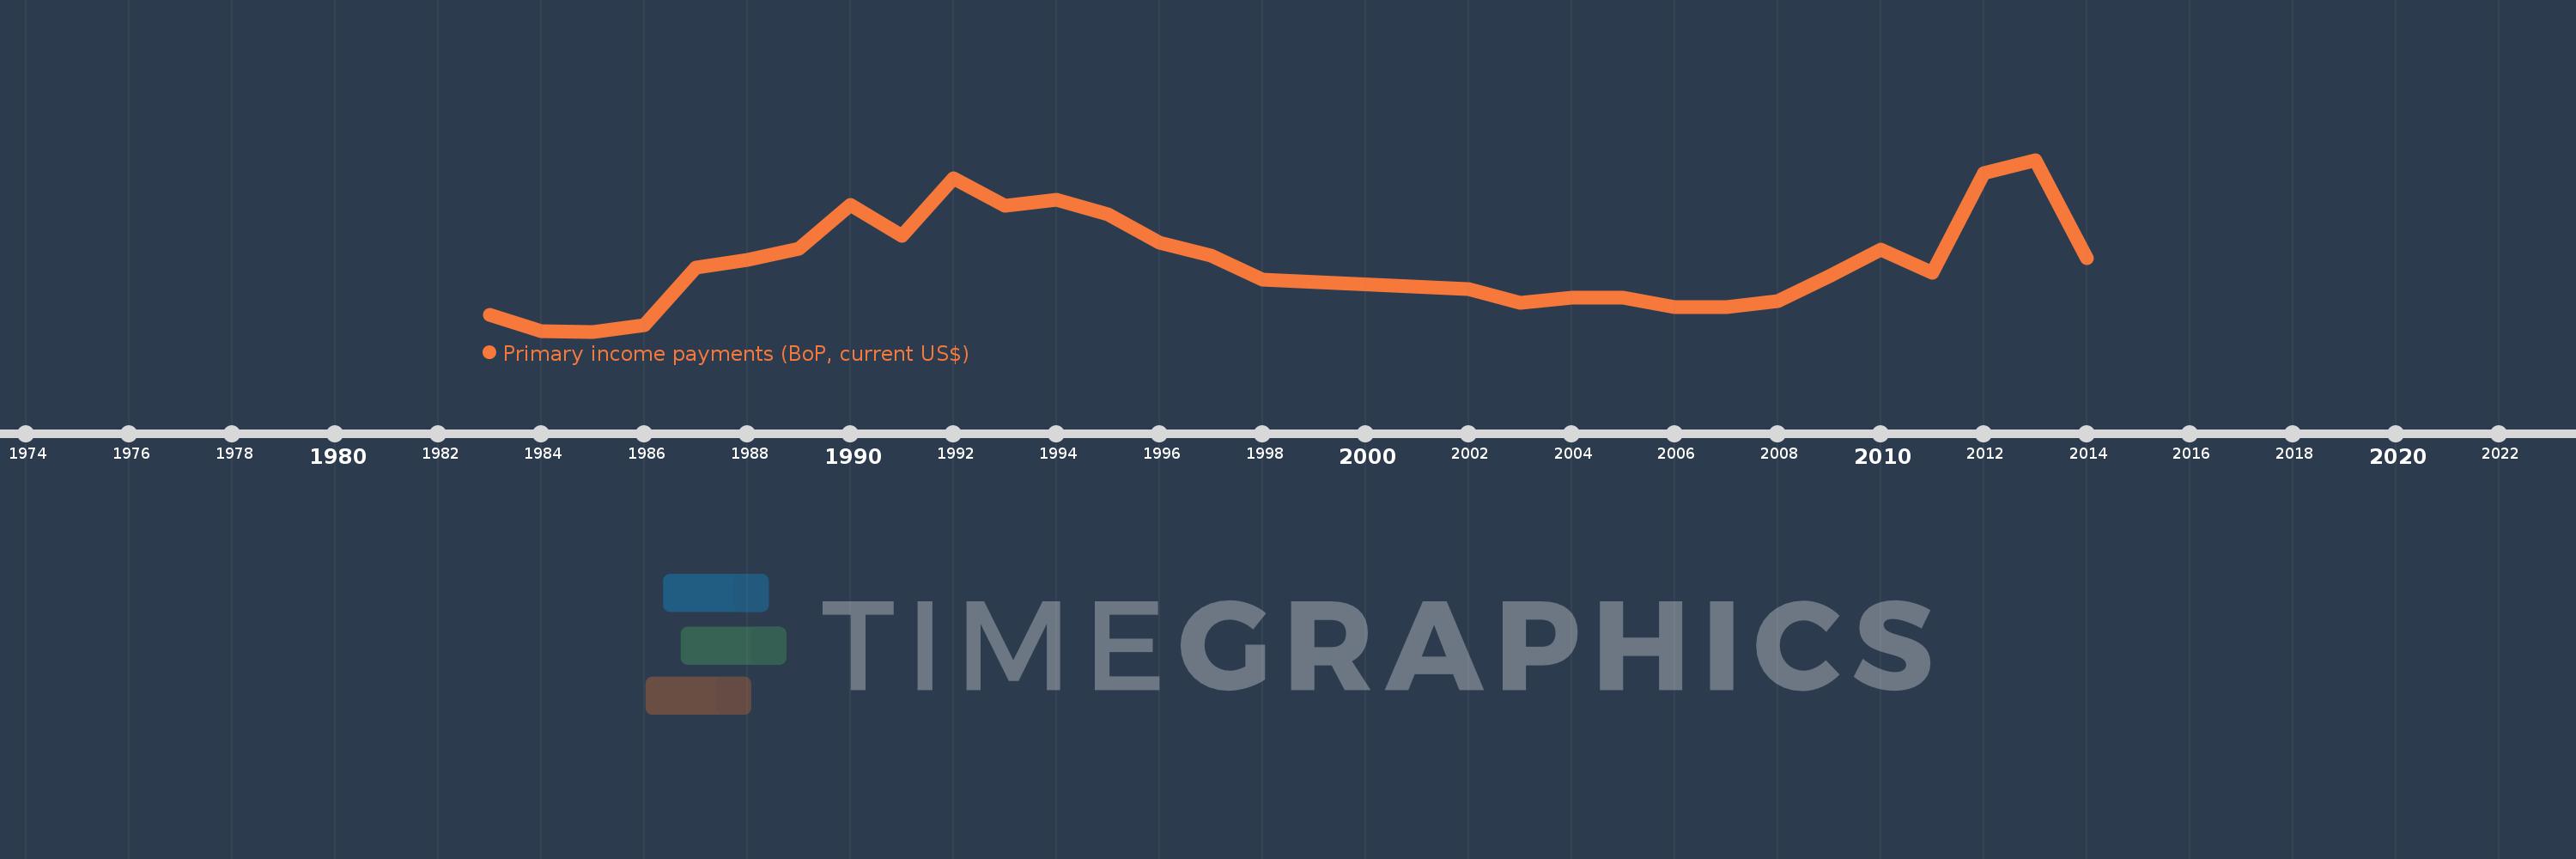
Primary income payments (BoP, current US$)
2014,2013,2012,2011,2010,2009,2008,2007,2006,2005,2004,2003,2002,1998,1997,1996,1995,1994,1993,1992,1991,1990,1989,1988,1987,1986,1985,1984,1983
This statistics in other country:
AfghanistanAlbaniaAlgeriaAngolaAntigua and BarbudaArab WorldArgentinaArmeniaArubaAustraliaAustriaAzerbaijanBahamas, TheBahrainBangladeshBarbadosBelarusBelgiumBelizeBeninBermudaBhutanBoliviaBosnia and HerzegovinaBotswanaBrazilBrunei DarussalamBulgariaBurkina FasoBurundiCabo VerdeCambodiaCameroonCanadaCaribbean small statesCentral African RepublicCentral Europe and the BalticsChadChileChinaColombiaComorosCongo, Dem. Rep.Congo, Rep.Costa RicaCote d'IvoireCroatiaCuracaoCyprusCzech RepublicDenmarkDjiboutiDominicaDominican RepublicEarly-demographic dividendEast Asia & PacificEast Asia & Pacific (excluding high income)East Asia & Pacific (IDA & IBRD countries)EcuadorEgypt, Arab Rep.El SalvadorEquatorial GuineaEritreaEstoniaEthiopiaEuro areaEurope & Central AsiaEurope & Central Asia (excluding high income)Europe & Central Asia (IDA & IBRD countries)European UnionFaroe IslandsFijiFinlandFragile and conflict affected situationsFranceFrench PolynesiaGabonGambia, TheGeorgiaGermanyGhanaGreeceGrenadaGuatemalaGuineaGuinea-BissauGuyanaHaitiHeavily indebted poor countries (HIPC)High incomeHondurasHong Kong SAR, ChinaHungaryIBRD onlyIcelandIDA & IBRD totalIDA blendIDA onlyIDA totalIndiaIndonesiaIran, Islamic Rep.IraqIrelandIsraelItalyJamaicaJapanJordanKazakhstanKenyaKiribatiKorea, Rep.KosovoKuwaitKyrgyz RepublicLao PDRLate-demographic dividendLatin America & Caribbean Latin America & Caribbean (excluding high income)Latin America & the Caribbean (IDA & IBRD countries)LatviaLeast developed countries: UN classificationLebanonLesothoLiberiaLibyaLithuaniaLow & middle incomeLow incomeLower middle incomeLuxembourgMacao SAR, ChinaMacedonia, FYRMadagascarMalawiMalaysiaMaldivesMaliMaltaMarshall IslandsMauritaniaMauritiusMexicoMicronesia, Fed. Sts.Middle East & North AfricaMiddle East & North Africa (excluding high income)Middle East & North Africa (IDA & IBRD countries)Middle incomeMoldovaMongoliaMontenegroMoroccoMozambiqueMyanmarNamibiaNepalNetherlandsNew CaledoniaNew ZealandNicaraguaNigerNigeriaNorth AmericaNorwayOECD membersOmanOther small statesPacific island small statesPakistanPalauPanamaPapua New GuineaParaguayPeruPhilippinesPolandPortugalPost-demographic dividendPre-demographic dividendQatarRomaniaRussian FederationRwandaSamoaSao Tome and PrincipeSaudi ArabiaSenegalSerbiaSeychellesSierra LeoneSingaporeSint Maarten (Dutch part)Slovak RepublicSloveniaSmall statesSolomon IslandsSouth AfricaSouth AsiaSouth Asia (IDA & IBRD)South SudanSpainSri LankaSt. Kitts and NevisSt. LuciaSt. Vincent and the GrenadinesSub-Saharan Africa Sub-Saharan Africa (excluding high income)Sub-Saharan Africa (IDA & IBRD countries)SudanSurinameSwazilandSwedenSwitzerlandSyrian Arab RepublicTajikistanTanzaniaThailandTimor-LesteTogoTongaTrinidad and TobagoTunisiaTurkeyTuvaluUgandaUkraineUnited KingdomUnited StatesUpper middle incomeUruguayVanuatuVenezuela, RBVietnamWest Bank and GazaWorldYemen, Rep.ZambiaZimbabwe Timeline:
This timeline shows a graph from 1983 to 2014 of Guinea-Bissau. No data until 1982. Number of actual observations by date: 29.
Source name:
World Development Indicators
Source organization:
International Monetary Fund, Balance of Payments Statistics Yearbook and data files.
Categories, topics:
Economy & Growth
Last updated:
apr 23, 2017
Indicators value changes by year
Minimum:
4.7 mln
jan 1, 1985
Maximum:
36.261 mln
jan 1, 2013
At the date of observation
Value
Absolute change
Change from previous value
jan 1, 1983
7.8 mln
+7.8 mln
0.0%
jan 1, 1984
4.8 mln
-3.0 mln
-38.46%
jan 1, 1985
4.7 mln
-100.0K
-2.08%
jan 1, 1986
5.9 mln
+1.2 mln
25.53%
jan 1, 1987
16.5 mln
+10.6 mln
179.66%
jan 1, 1988
17.9 mln
+1.4 mln
8.48%
jan 1, 1989
19.9 mln
+2.0 mln
11.17%
jan 1, 1990
28.05 mln
+8.15 mln
40.95%
jan 1, 1991
22.28 mln
-5.77 mln
-20.57%
jan 1, 1992
32.91 mln
+10.63 mln
47.71%
jan 1, 1993
27.78 mln
-5.13 mln
-15.59%
jan 1, 1994
28.98 mln
+1.2 mln
4.32%
jan 1, 1995
26.27 mln
-2.71 mln
-9.35%
jan 1, 1996
21.09 mln
-5.18 mln
-19.72%
jan 1, 1997
18.65 mln
-2.44 mln
-11.57%
jan 1, 1998
14.3 mln
-4.35 mln
-23.32%
jan 1, 2002
12.576 mln
-1.724 mln
-12.05%
jan 1, 2003
10.048 mln
-2.529 mln
-20.11%
jan 1, 2004
10.908 mln
+860.944K
8.57%
jan 1, 2005
10.939 mln
+30.716K
0.28%
jan 1, 2006
9.259 mln
-1.68 mln
-15.36%
jan 1, 2007
9.128 mln
-131.214K
-1.42%
jan 1, 2008
10.34 mln
+1.212 mln
13.28%
jan 1, 2009
14.88 mln
+4.54 mln
43.91%
jan 1, 2010
19.75 mln
+4.87 mln
32.73%
jan 1, 2011
15.52 mln
-4.23 mln
-21.42%
jan 1, 2012
33.77 mln
+18.249 mln
117.59%
jan 1, 2013
36.261 mln
+2.491 mln
7.38%
jan 1, 2014
18.258 mln
-18.003 mln
-49.65%
Ranking of countries by current statistics by years


Comments: