29
/
en
AIzaSyAYiBZKx7MnpbEhh9jyipgxe19OcubqV5w
April 1, 2024
57582
South Asia
SAS
false
2
1
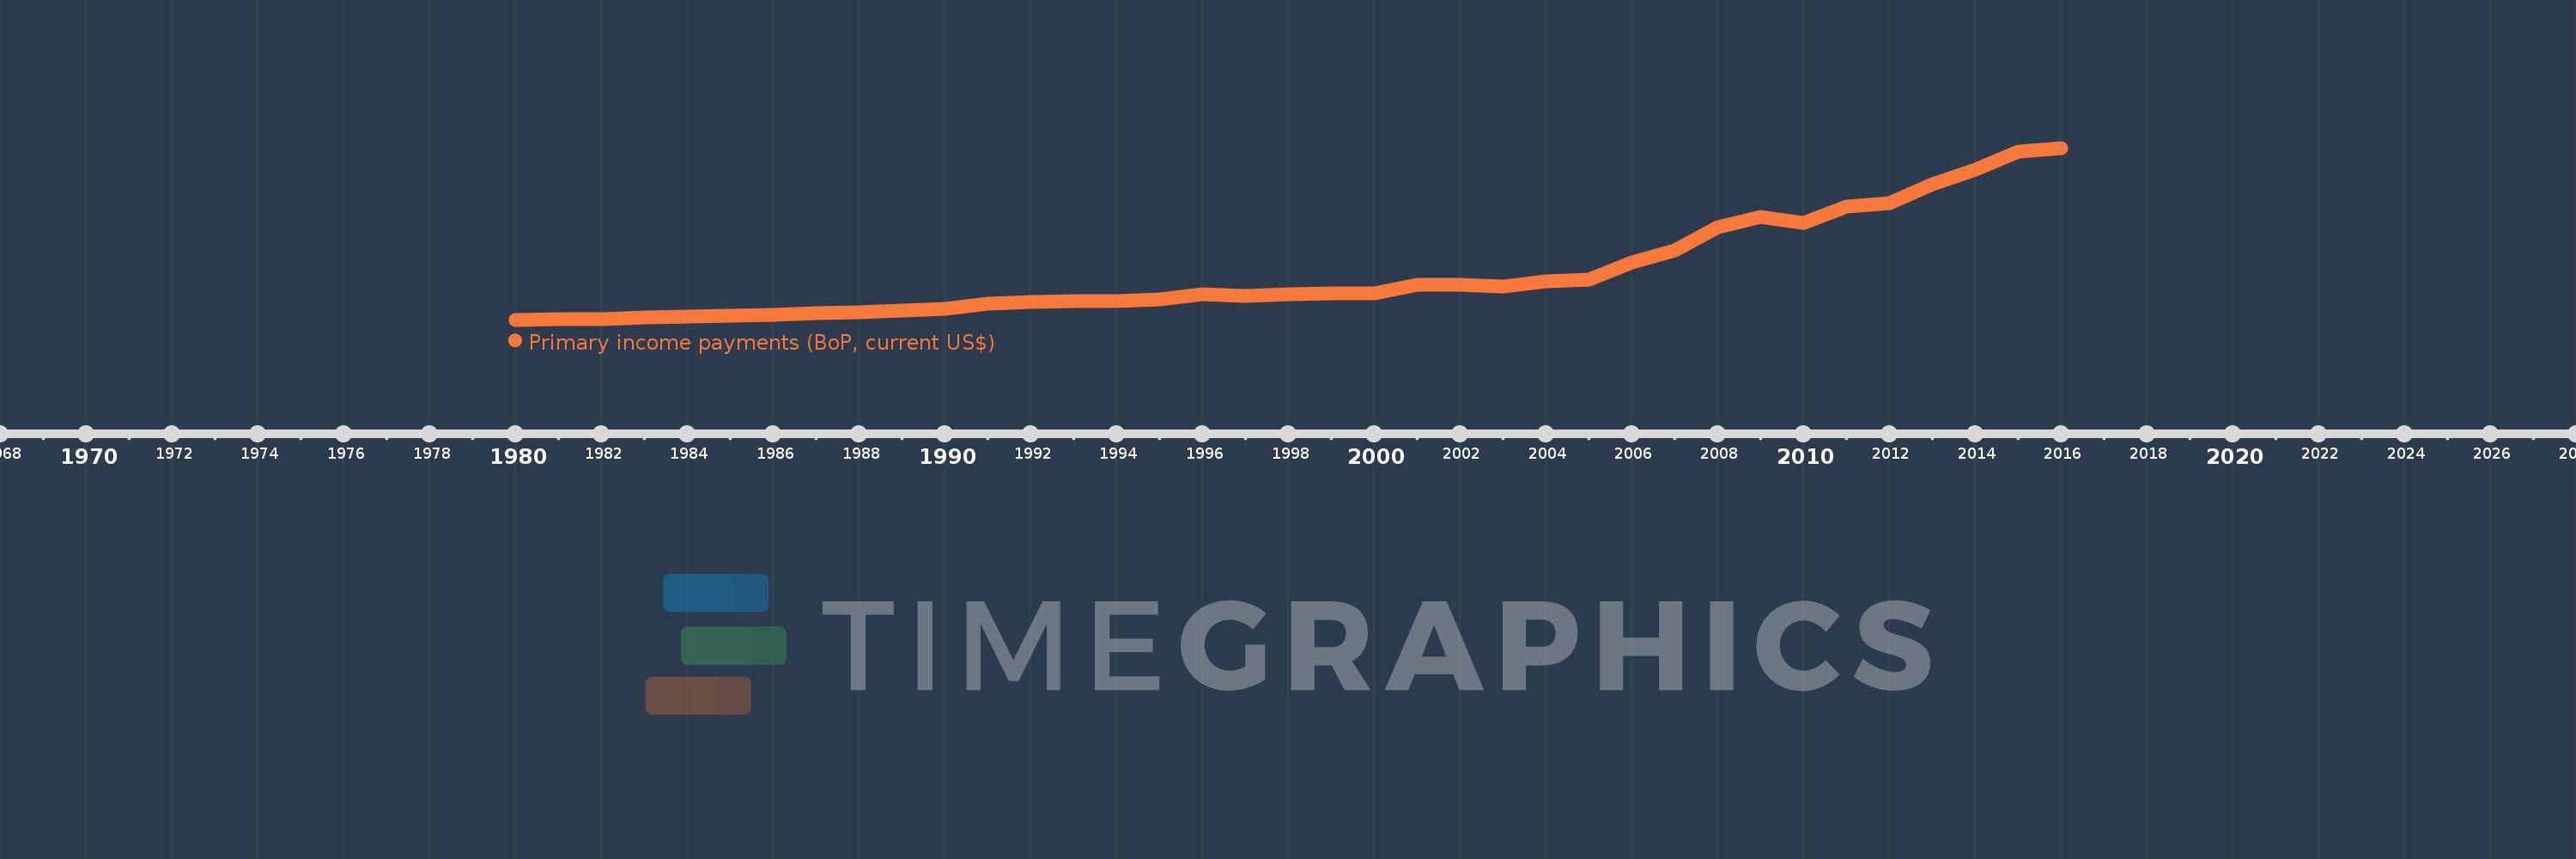
Primary income payments (BoP, current US$)
2016,2015,2014,2013,2012,2011,2010,2009,2008,2007,2006,2005,2004,2003,2002,2001,2000,1999,1998,1997,1996,1995,1994,1993,1992,1991,1990,1989,1988,1987,1986,1985,1984,1983,1982,1981,1980
This statistics in other country:
AfghanistanAlbaniaAlgeriaAngolaAntigua and BarbudaArab WorldArgentinaArmeniaArubaAustraliaAustriaAzerbaijanBahamas, TheBahrainBangladeshBarbadosBelarusBelgiumBelizeBeninBermudaBhutanBoliviaBosnia and HerzegovinaBotswanaBrazilBrunei DarussalamBulgariaBurkina FasoBurundiCabo VerdeCambodiaCameroonCanadaCaribbean small statesCentral African RepublicCentral Europe and the BalticsChadChileChinaColombiaComorosCongo, Dem. Rep.Congo, Rep.Costa RicaCote d'IvoireCroatiaCuracaoCyprusCzech RepublicDenmarkDjiboutiDominicaDominican RepublicEarly-demographic dividendEast Asia & PacificEast Asia & Pacific (excluding high income)East Asia & Pacific (IDA & IBRD countries)EcuadorEgypt, Arab Rep.El SalvadorEquatorial GuineaEritreaEstoniaEthiopiaEuro areaEurope & Central AsiaEurope & Central Asia (excluding high income)Europe & Central Asia (IDA & IBRD countries)European UnionFaroe IslandsFijiFinlandFragile and conflict affected situationsFranceFrench PolynesiaGabonGambia, TheGeorgiaGermanyGhanaGreeceGrenadaGuatemalaGuineaGuinea-BissauGuyanaHaitiHeavily indebted poor countries (HIPC)High incomeHondurasHong Kong SAR, ChinaHungaryIBRD onlyIcelandIDA & IBRD totalIDA blendIDA onlyIDA totalIndiaIndonesiaIran, Islamic Rep.IraqIrelandIsraelItalyJamaicaJapanJordanKazakhstanKenyaKiribatiKorea, Rep.KosovoKuwaitKyrgyz RepublicLao PDRLate-demographic dividendLatin America & Caribbean Latin America & Caribbean (excluding high income)Latin America & the Caribbean (IDA & IBRD countries)LatviaLeast developed countries: UN classificationLebanonLesothoLiberiaLibyaLithuaniaLow & middle incomeLow incomeLower middle incomeLuxembourgMacao SAR, ChinaMacedonia, FYRMadagascarMalawiMalaysiaMaldivesMaliMaltaMarshall IslandsMauritaniaMauritiusMexicoMicronesia, Fed. Sts.Middle East & North AfricaMiddle East & North Africa (excluding high income)Middle East & North Africa (IDA & IBRD countries)Middle incomeMoldovaMongoliaMontenegroMoroccoMozambiqueMyanmarNamibiaNepalNetherlandsNew CaledoniaNew ZealandNicaraguaNigerNigeriaNorth AmericaNorwayOECD membersOmanOther small statesPacific island small statesPakistanPalauPanamaPapua New GuineaParaguayPeruPhilippinesPolandPortugalPost-demographic dividendPre-demographic dividendQatarRomaniaRussian FederationRwandaSamoaSao Tome and PrincipeSaudi ArabiaSenegalSerbiaSeychellesSierra LeoneSingaporeSint Maarten (Dutch part)Slovak RepublicSloveniaSmall statesSolomon IslandsSouth AfricaSouth AsiaSouth Asia (IDA & IBRD)South SudanSpainSri LankaSt. Kitts and NevisSt. LuciaSt. Vincent and the GrenadinesSub-Saharan Africa Sub-Saharan Africa (excluding high income)Sub-Saharan Africa (IDA & IBRD countries)SudanSurinameSwazilandSwedenSwitzerlandSyrian Arab RepublicTajikistanTanzaniaThailandTimor-LesteTogoTongaTrinidad and TobagoTunisiaTurkeyTuvaluUgandaUkraineUnited KingdomUnited StatesUpper middle incomeUruguayVanuatuVenezuela, RBVietnamWest Bank and GazaWorldYemen, Rep.ZambiaZimbabwe Timeline:
This timeline shows a graph from 1980 to 2016 of South Asia. No data until 1979. Number of actual observations by date: 37.
Source name:
World Development Indicators
Source organization:
International Monetary Fund, Balance of Payments Statistics Yearbook and data files.
Categories, topics:
Economy & Growth
Last updated:
apr 23, 2017
Indicators value changes by year
Minimum:
946.95 mln
jan 1, 1980
Maximum:
48.995 bln
jan 1, 2016
At the date of observation
Value
Absolute change
Change from previous value
jan 1, 1980
946.95 mln
+946.95 mln
0.0%
jan 1, 1981
1.037 bln
+90.369 mln
9.54%
jan 1, 1982
1.144 bln
+106.881 mln
10.3%
jan 1, 1983
1.545 bln
+400.385 mln
34.99%
jan 1, 1984
1.896 bln
+350.994 mln
22.72%
jan 1, 1985
2.195 bln
+299.795 mln
15.82%
jan 1, 1986
2.431 bln
+236.054 mln
10.75%
jan 1, 1987
2.77 bln
+338.11 mln
13.91%
jan 1, 1988
2.933 bln
+163.466 mln
5.9%
jan 1, 1989
3.582 bln
+648.564 mln
22.11%
jan 1, 1990
4.06 bln
+478.195 mln
13.35%
jan 1, 1991
5.343 bln
+1.283 bln
31.61%
jan 1, 1992
5.931 bln
+587.384 mln
10.99%
jan 1, 1993
6.222 bln
+291.348 mln
4.91%
jan 1, 1994
6.187 bln
-35.179 mln
-0.57%
jan 1, 1995
6.755 bln
+568.371 mln
9.19%
jan 1, 1996
7.966 bln
+1.211 bln
17.93%
jan 1, 1997
7.496 bln
-470.794 mln
-5.91%
jan 1, 1998
8.022 bln
+526.952 mln
7.03%
jan 1, 1999
8.369 bln
+347.022 mln
4.33%
jan 1, 2000
8.335 bln
-34.905 mln
-0.42%
jan 1, 2001
10.619 bln
+2.284 bln
27.4%
jan 1, 2002
10.695 bln
+76.789 mln
0.72%
jan 1, 2003
10.273 bln
-421.865 mln
-3.94%
jan 1, 2004
11.606 bln
+1.333 bln
12.97%
jan 1, 2005
12.283 bln
+677.199 mln
5.83%
jan 1, 2006
16.892 bln
+4.609 bln
37.52%
jan 1, 2007
20.339 bln
+3.448 bln
20.41%
jan 1, 2008
26.71 bln
+6.371 bln
31.32%
jan 1, 2009
29.61 bln
+2.9 bln
10.86%
jan 1, 2010
28.06 bln
-1.55 bln
-5.23%
jan 1, 2011
32.593 bln
+4.533 bln
16.16%
jan 1, 2012
33.643 bln
+1.05 bln
3.22%
jan 1, 2013
38.744 bln
+5.1 bln
15.16%
jan 1, 2014
42.804 bln
+4.06 bln
10.48%
jan 1, 2015
47.915 bln
+5.111 bln
11.94%
jan 1, 2016
48.995 bln
+1.08 bln
2.25%
Ranking of countries by current statistics by years


Comments: