29
/
en
AIzaSyAYiBZKx7MnpbEhh9jyipgxe19OcubqV5w
April 1, 2024
256749
Sweden
SWE
true
2
1
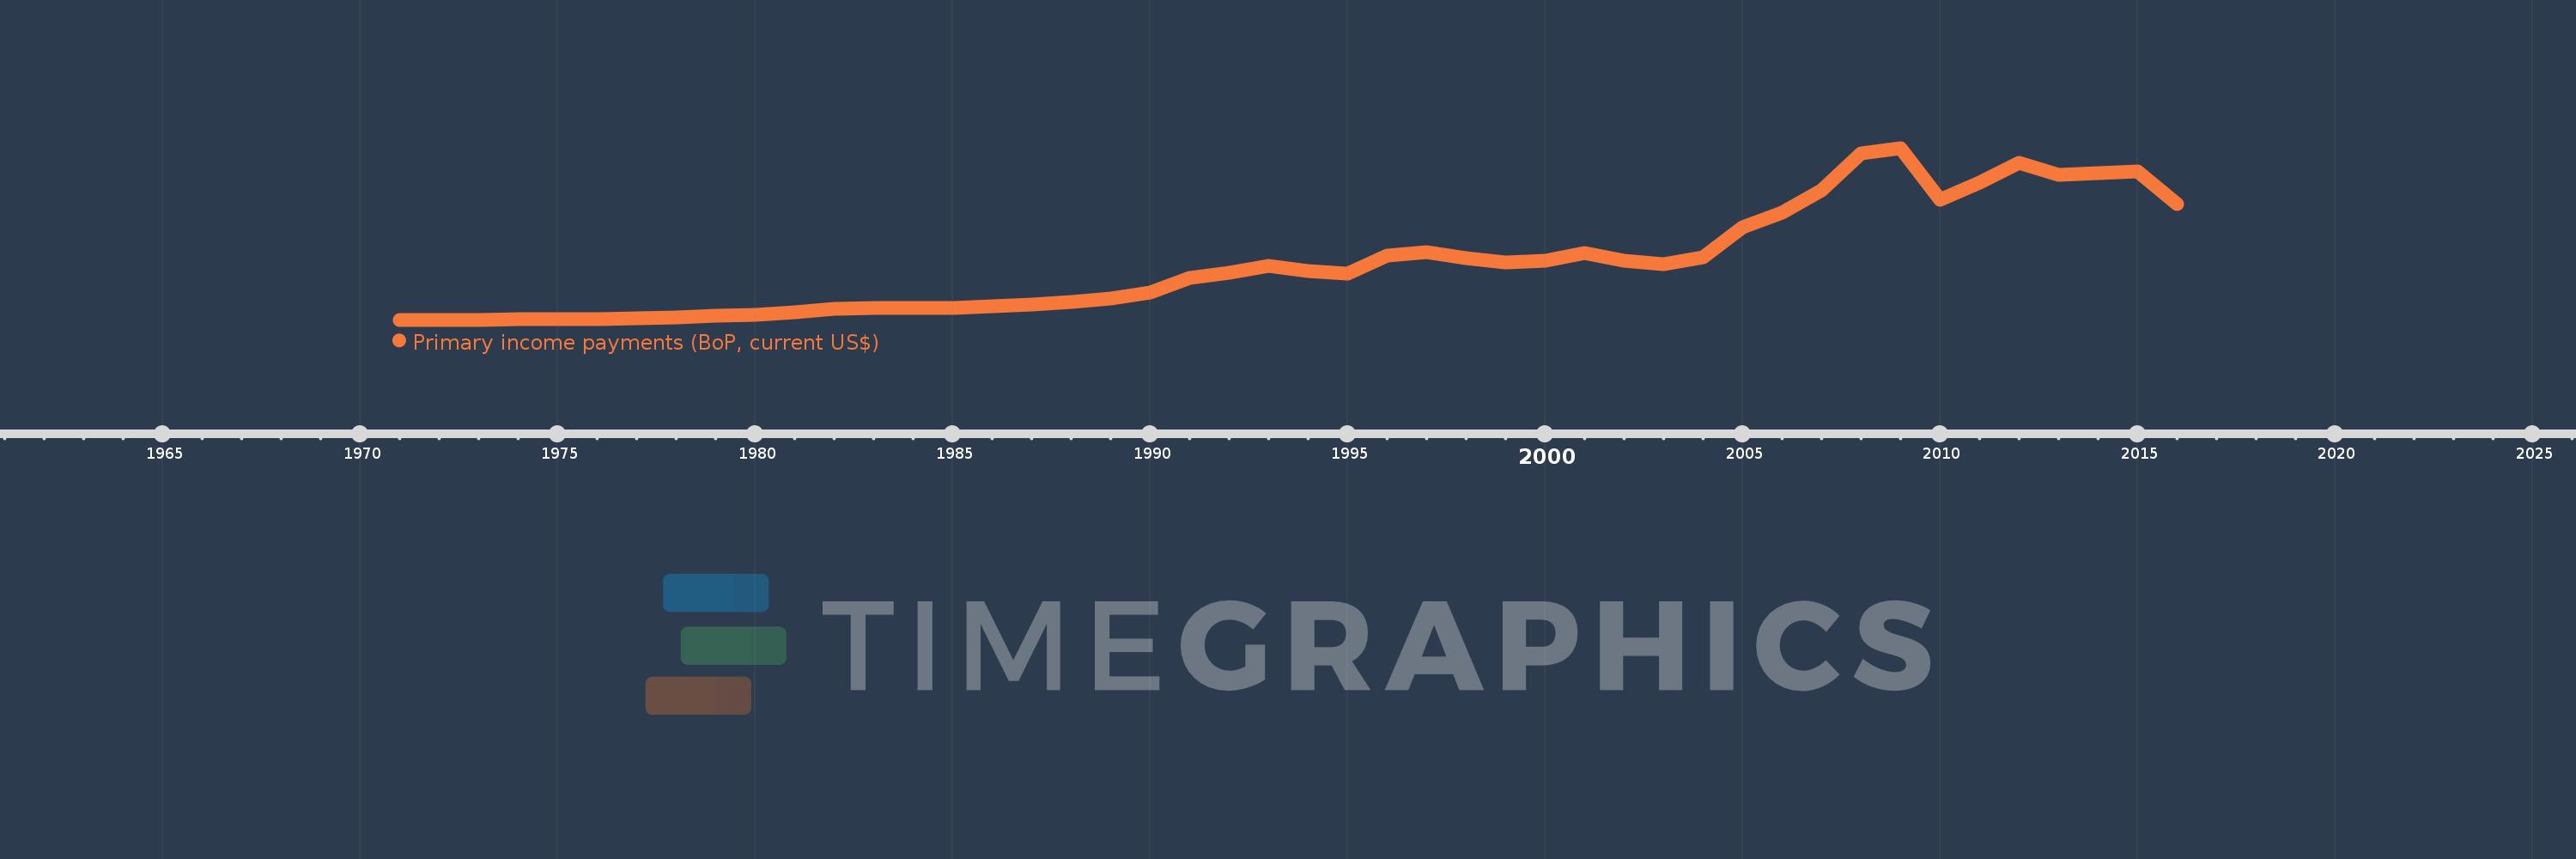
Primary income payments (BoP, current US$)
2016,2015,2014,2013,2012,2011,2010,2009,2008,2007,2006,2005,2004,2003,2002,2001,2000,1999,1998,1997,1996,1995,1994,1993,1992,1991,1990,1989,1988,1987,1986,1985,1984,1983,1982,1981,1980,1979,1978,1977,1976,1975,1974,1973,1972,1971
This statistics in other country:
AfghanistanAlbaniaAlgeriaAngolaAntigua and BarbudaArab WorldArgentinaArmeniaArubaAustraliaAustriaAzerbaijanBahamas, TheBahrainBangladeshBarbadosBelarusBelgiumBelizeBeninBermudaBhutanBoliviaBosnia and HerzegovinaBotswanaBrazilBrunei DarussalamBulgariaBurkina FasoBurundiCabo VerdeCambodiaCameroonCanadaCaribbean small statesCentral African RepublicCentral Europe and the BalticsChadChileChinaColombiaComorosCongo, Dem. Rep.Congo, Rep.Costa RicaCote d'IvoireCroatiaCuracaoCyprusCzech RepublicDenmarkDjiboutiDominicaDominican RepublicEarly-demographic dividendEast Asia & PacificEast Asia & Pacific (excluding high income)East Asia & Pacific (IDA & IBRD countries)EcuadorEgypt, Arab Rep.El SalvadorEquatorial GuineaEritreaEstoniaEthiopiaEuro areaEurope & Central AsiaEurope & Central Asia (excluding high income)Europe & Central Asia (IDA & IBRD countries)European UnionFaroe IslandsFijiFinlandFragile and conflict affected situationsFranceFrench PolynesiaGabonGambia, TheGeorgiaGermanyGhanaGreeceGrenadaGuatemalaGuineaGuinea-BissauGuyanaHaitiHeavily indebted poor countries (HIPC)High incomeHondurasHong Kong SAR, ChinaHungaryIBRD onlyIcelandIDA & IBRD totalIDA blendIDA onlyIDA totalIndiaIndonesiaIran, Islamic Rep.IraqIrelandIsraelItalyJamaicaJapanJordanKazakhstanKenyaKiribatiKorea, Rep.KosovoKuwaitKyrgyz RepublicLao PDRLate-demographic dividendLatin America & Caribbean Latin America & Caribbean (excluding high income)Latin America & the Caribbean (IDA & IBRD countries)LatviaLeast developed countries: UN classificationLebanonLesothoLiberiaLibyaLithuaniaLow & middle incomeLow incomeLower middle incomeLuxembourgMacao SAR, ChinaMacedonia, FYRMadagascarMalawiMalaysiaMaldivesMaliMaltaMarshall IslandsMauritaniaMauritiusMexicoMicronesia, Fed. Sts.Middle East & North AfricaMiddle East & North Africa (excluding high income)Middle East & North Africa (IDA & IBRD countries)Middle incomeMoldovaMongoliaMontenegroMoroccoMozambiqueMyanmarNamibiaNepalNetherlandsNew CaledoniaNew ZealandNicaraguaNigerNigeriaNorth AmericaNorwayOECD membersOmanOther small statesPacific island small statesPakistanPalauPanamaPapua New GuineaParaguayPeruPhilippinesPolandPortugalPost-demographic dividendPre-demographic dividendQatarRomaniaRussian FederationRwandaSamoaSao Tome and PrincipeSaudi ArabiaSenegalSerbiaSeychellesSierra LeoneSingaporeSint Maarten (Dutch part)Slovak RepublicSloveniaSmall statesSolomon IslandsSouth AfricaSouth AsiaSouth Asia (IDA & IBRD)South SudanSpainSri LankaSt. Kitts and NevisSt. LuciaSt. Vincent and the GrenadinesSub-Saharan Africa Sub-Saharan Africa (excluding high income)Sub-Saharan Africa (IDA & IBRD countries)SudanSurinameSwazilandSwedenSwitzerlandSyrian Arab RepublicTajikistanTanzaniaThailandTimor-LesteTogoTongaTrinidad and TobagoTunisiaTurkeyTuvaluUgandaUkraineUnited KingdomUnited StatesUpper middle incomeUruguayVanuatuVenezuela, RBVietnamWest Bank and GazaWorldYemen, Rep.ZambiaZimbabwe Timeline:
This timeline shows a graph from 1971 to 2016 of Sweden. No data until 1970. Number of actual observations by date: 46.
Source name:
World Development Indicators
Source organization:
International Monetary Fund, Balance of Payments Statistics Yearbook and data files.
Categories, topics:
Economy & Growth
Last updated:
apr 23, 2017
Indicators value changes by year
Minimum:
144.978 mln
jan 1, 1971
Maximum:
57.344 bln
jan 1, 2009
At the date of observation
Value
Absolute change
Change from previous value
jan 1, 1971
144.978 mln
+144.978 mln
0.0%
jan 1, 1972
156.07 mln
+11.092 mln
7.65%
jan 1, 1973
182.68 mln
+26.61 mln
17.05%
jan 1, 1974
258.744 mln
+76.064 mln
41.64%
jan 1, 1975
317.609 mln
+58.865 mln
22.75%
jan 1, 1976
403.564 mln
+85.955 mln
27.06%
jan 1, 1977
664.601 mln
+261.037 mln
64.68%
jan 1, 1978
961.67 mln
+297.069 mln
44.7%
jan 1, 1979
1.49 bln
+528.636 mln
54.97%
jan 1, 1980
1.755 bln
+264.509 mln
17.75%
jan 1, 1981
2.617 bln
+862.669 mln
49.16%
jan 1, 1982
3.79 bln
+1.173 bln
44.81%
jan 1, 1983
4.159 bln
+369.109 mln
9.74%
jan 1, 1984
3.962 bln
-197.718 mln
-4.75%
jan 1, 1985
4.201 bln
+239.083 mln
6.03%
jan 1, 1986
4.561 bln
+360.161 mln
8.57%
jan 1, 1987
5.187 bln
+626.205 mln
13.73%
jan 1, 1988
5.935 bln
+748.291 mln
14.43%
jan 1, 1989
7.07 bln
+1.135 bln
19.12%
jan 1, 1990
9.302 bln
+2.232 bln
31.56%
jan 1, 1991
14.164 bln
+4.862 bln
52.27%
jan 1, 1992
15.833 bln
+1.67 bln
11.79%
jan 1, 1993
18.181 bln
+2.348 bln
14.83%
jan 1, 1994
16.261 bln
-1.92 bln
-10.56%
jan 1, 1995
15.53 bln
-730.592 mln
-4.49%
jan 1, 1996
21.379 bln
+5.849 bln
37.66%
jan 1, 1997
22.641 bln
+1.262 bln
5.9%
jan 1, 1998
20.513 bln
-2.128 bln
-9.4%
jan 1, 1999
19.264 bln
-1.249 bln
-6.09%
jan 1, 2000
19.833 bln
+568.193 mln
2.95%
jan 1, 2001
22.429 bln
+2.596 bln
13.09%
jan 1, 2002
19.758 bln
-2.671 bln
-11.91%
jan 1, 2003
18.584 bln
-1.175 bln
-5.95%
jan 1, 2004
21.054 bln
+2.471 bln
13.3%
jan 1, 2005
30.993 bln
+9.939 bln
47.21%
jan 1, 2006
35.835 bln
+4.841 bln
15.62%
jan 1, 2007
43.272 bln
+7.438 bln
20.76%
jan 1, 2008
55.55 bln
+12.278 bln
28.37%
jan 1, 2009
57.344 bln
+1.794 bln
3.23%
jan 1, 2010
40.007 bln
-17.338 bln
-30.23%
jan 1, 2011
45.826 bln
+5.819 bln
14.55%
jan 1, 2012
52.458 bln
+6.632 bln
14.47%
jan 1, 2013
48.518 bln
-3.94 bln
-7.51%
jan 1, 2014
48.914 bln
+395.734 mln
0.82%
jan 1, 2015
49.642 bln
+728.563 mln
1.49%
jan 1, 2016
38.614 bln
-11.029 bln
-22.22%
Ranking of countries by current statistics by years


Comments: