29
/
en
AIzaSyAYiBZKx7MnpbEhh9jyipgxe19OcubqV5w
April 1, 2024
50396
Middle East & North Africa (IDA & IBRD countries)
TMN
false
2
1
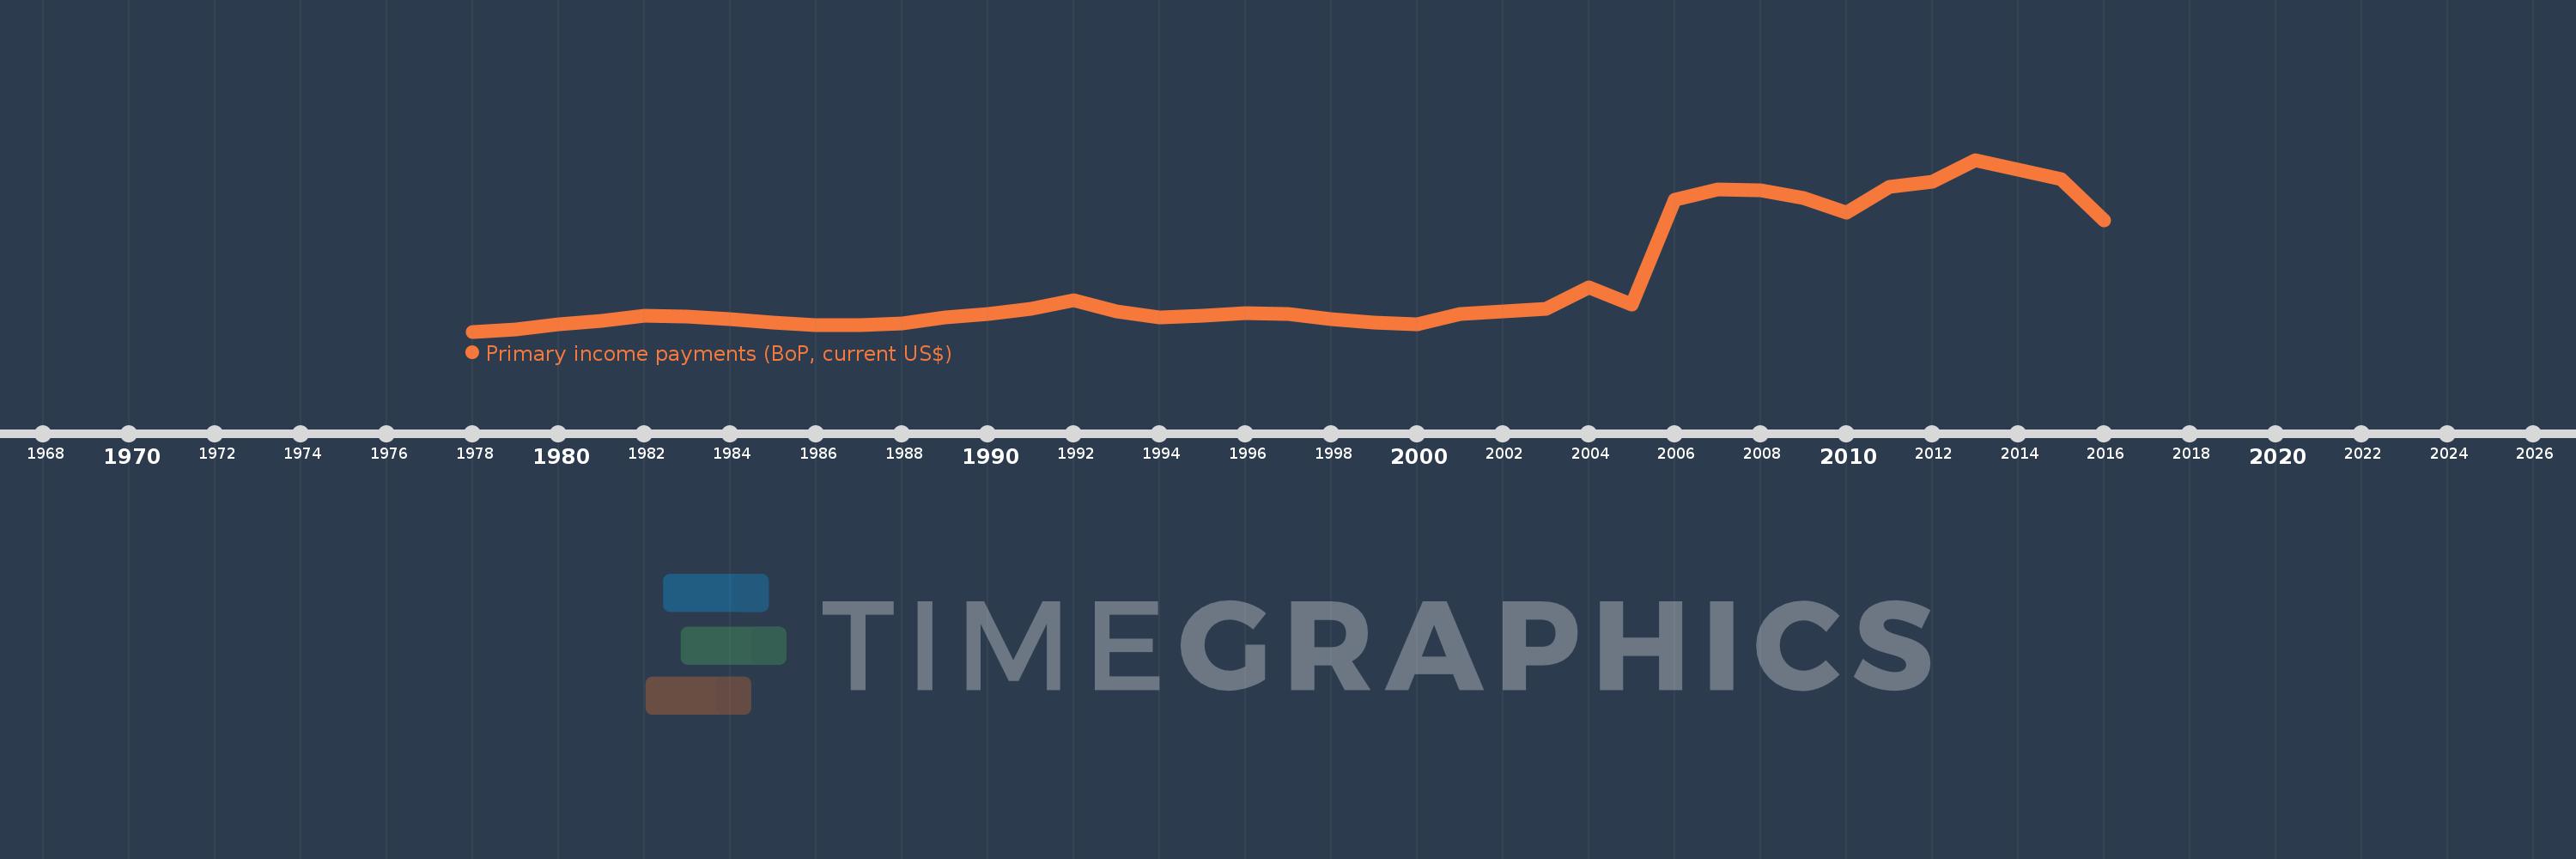
Primary income payments (BoP, current US$)
2016,2015,2014,2013,2012,2011,2010,2009,2008,2007,2006,2005,2004,2003,2001,2000,1999,1998,1997,1996,1995,1994,1993,1992,1991,1990,1989,1988,1987,1986,1985,1984,1983,1982,1981,1980,1979,1978
This statistics in other country:
AfghanistanAlbaniaAlgeriaAngolaAntigua and BarbudaArab WorldArgentinaArmeniaArubaAustraliaAustriaAzerbaijanBahamas, TheBahrainBangladeshBarbadosBelarusBelgiumBelizeBeninBermudaBhutanBoliviaBosnia and HerzegovinaBotswanaBrazilBrunei DarussalamBulgariaBurkina FasoBurundiCabo VerdeCambodiaCameroonCanadaCaribbean small statesCentral African RepublicCentral Europe and the BalticsChadChileChinaColombiaComorosCongo, Dem. Rep.Congo, Rep.Costa RicaCote d'IvoireCroatiaCuracaoCyprusCzech RepublicDenmarkDjiboutiDominicaDominican RepublicEarly-demographic dividendEast Asia & PacificEast Asia & Pacific (excluding high income)East Asia & Pacific (IDA & IBRD countries)EcuadorEgypt, Arab Rep.El SalvadorEquatorial GuineaEritreaEstoniaEthiopiaEuro areaEurope & Central AsiaEurope & Central Asia (excluding high income)Europe & Central Asia (IDA & IBRD countries)European UnionFaroe IslandsFijiFinlandFragile and conflict affected situationsFranceFrench PolynesiaGabonGambia, TheGeorgiaGermanyGhanaGreeceGrenadaGuatemalaGuineaGuinea-BissauGuyanaHaitiHeavily indebted poor countries (HIPC)High incomeHondurasHong Kong SAR, ChinaHungaryIBRD onlyIcelandIDA & IBRD totalIDA blendIDA onlyIDA totalIndiaIndonesiaIran, Islamic Rep.IraqIrelandIsraelItalyJamaicaJapanJordanKazakhstanKenyaKiribatiKorea, Rep.KosovoKuwaitKyrgyz RepublicLao PDRLate-demographic dividendLatin America & Caribbean Latin America & Caribbean (excluding high income)Latin America & the Caribbean (IDA & IBRD countries)LatviaLeast developed countries: UN classificationLebanonLesothoLiberiaLibyaLithuaniaLow & middle incomeLow incomeLower middle incomeLuxembourgMacao SAR, ChinaMacedonia, FYRMadagascarMalawiMalaysiaMaldivesMaliMaltaMarshall IslandsMauritaniaMauritiusMexicoMicronesia, Fed. Sts.Middle East & North AfricaMiddle East & North Africa (excluding high income)Middle East & North Africa (IDA & IBRD countries)Middle incomeMoldovaMongoliaMontenegroMoroccoMozambiqueMyanmarNamibiaNepalNetherlandsNew CaledoniaNew ZealandNicaraguaNigerNigeriaNorth AmericaNorwayOECD membersOmanOther small statesPacific island small statesPakistanPalauPanamaPapua New GuineaParaguayPeruPhilippinesPolandPortugalPost-demographic dividendPre-demographic dividendQatarRomaniaRussian FederationRwandaSamoaSao Tome and PrincipeSaudi ArabiaSenegalSerbiaSeychellesSierra LeoneSingaporeSint Maarten (Dutch part)Slovak RepublicSloveniaSmall statesSolomon IslandsSouth AfricaSouth AsiaSouth Asia (IDA & IBRD)South SudanSpainSri LankaSt. Kitts and NevisSt. LuciaSt. Vincent and the GrenadinesSub-Saharan Africa Sub-Saharan Africa (excluding high income)Sub-Saharan Africa (IDA & IBRD countries)SudanSurinameSwazilandSwedenSwitzerlandSyrian Arab RepublicTajikistanTanzaniaThailandTimor-LesteTogoTongaTrinidad and TobagoTunisiaTurkeyTuvaluUgandaUkraineUnited KingdomUnited StatesUpper middle incomeUruguayVanuatuVenezuela, RBVietnamWest Bank and GazaWorldYemen, Rep.ZambiaZimbabwe Timeline:
This timeline shows a graph from 1978 to 2016 of Middle East & North Africa (IDA & IBRD countries). No data until 1977. Number of actual observations by date: 38.
Source name:
World Development Indicators
Source organization:
International Monetary Fund, Balance of Payments Statistics Yearbook and data files.
Categories, topics:
Economy & Growth
Last updated:
apr 23, 2017
Indicators value changes by year
Minimum:
4.155 bln
jan 1, 1978
Maximum:
29.47 bln
jan 1, 2013
At the date of observation
Value
Absolute change
Change from previous value
jan 1, 1978
4.155 bln
+4.155 bln
0.0%
jan 1, 1979
4.484 bln
+329.202 mln
7.92%
jan 1, 1980
5.177 bln
+693.121 mln
15.46%
jan 1, 1981
5.685 bln
+508.108 mln
9.81%
jan 1, 1982
6.535 bln
+849.423 mln
14.94%
jan 1, 1983
6.377 bln
-158.019 mln
-2.42%
jan 1, 1984
5.938 bln
-438.512 mln
-6.88%
jan 1, 1985
5.544 bln
-394.36 mln
-6.64%
jan 1, 1986
5.095 bln
-448.705 mln
-8.09%
jan 1, 1987
5.112 bln
+17.138 mln
0.34%
jan 1, 1988
5.385 bln
+273.038 mln
5.34%
jan 1, 1989
6.249 bln
+864.031 mln
16.04%
jan 1, 1990
6.727 bln
+478.192 mln
7.65%
jan 1, 1991
7.526 bln
+798.427 mln
11.87%
jan 1, 1992
8.822 bln
+1.297 bln
17.23%
jan 1, 1993
7.084 bln
-1.739 bln
-19.71%
jan 1, 1994
6.252 bln
-831.698 mln
-11.74%
jan 1, 1995
6.462 bln
+209.492 mln
3.35%
jan 1, 1996
6.89 bln
+428.752 mln
6.64%
jan 1, 1997
6.715 bln
-175.577 mln
-2.55%
jan 1, 1998
5.963 bln
-751.878 mln
-11.2%
jan 1, 1999
5.493 bln
-470.419 mln
-7.89%
jan 1, 2000
5.291 bln
-201.615 mln
-3.67%
jan 1, 2001
6.716 bln
+1.426 bln
26.94%
jan 1, 2003
7.512 bln
+795.5 mln
11.84%
jan 1, 2004
10.729 bln
+3.217 bln
42.83%
jan 1, 2005
8.183 bln
-2.546 bln
-23.73%
jan 1, 2006
23.601 bln
+15.417 bln
188.41%
jan 1, 2007
25.143 bln
+1.542 bln
6.54%
jan 1, 2008
25.004 bln
-139.342 mln
-0.55%
jan 1, 2009
23.79 bln
-1.214 bln
-4.85%
jan 1, 2010
21.688 bln
-2.102 bln
-8.83%
jan 1, 2011
25.487 bln
+3.799 bln
17.52%
jan 1, 2012
26.302 bln
+814.336 mln
3.2%
jan 1, 2013
29.47 bln
+3.168 bln
12.04%
jan 1, 2014
27.957 bln
-1.512 bln
-5.13%
jan 1, 2015
26.574 bln
-1.383 bln
-4.95%
jan 1, 2016
20.592 bln
-5.982 bln
-22.51%
Ranking of countries by current statistics by years


Comments: