29
/
en
AIzaSyAYiBZKx7MnpbEhh9jyipgxe19OcubqV5w
April 1, 2024
44603
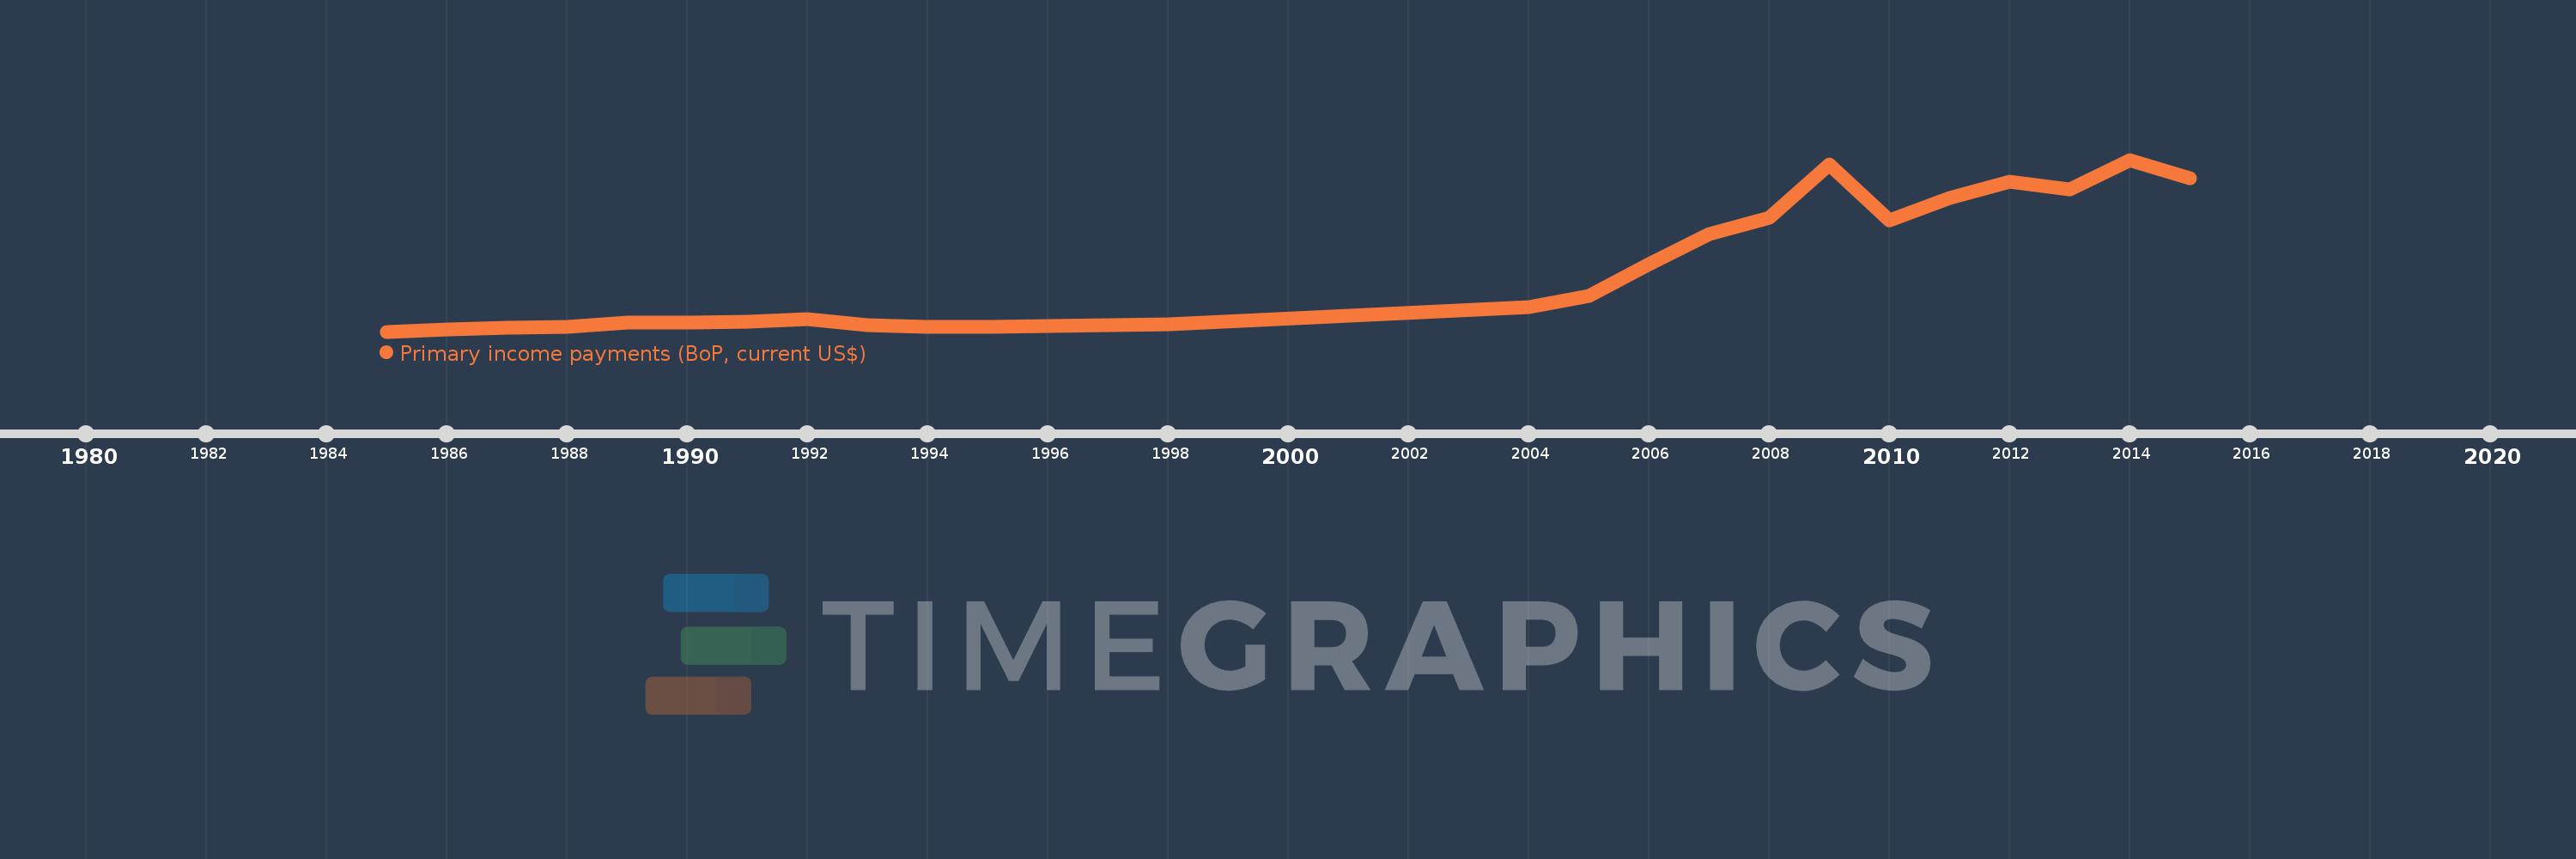
Least developed countries: UN classification
LDC
false
2
1
Primary income payments (BoP, current US$)
2015,2014,2013,2012,2011,2010,2009,2008,2007,2006,2005,2004,1998,1995,1994,1993,1992,1991,1990,1989,1988,1987,1986,1985
This statistics in other country:
AfghanistanAlbaniaAlgeriaAngolaAntigua and BarbudaArab WorldArgentinaArmeniaArubaAustraliaAustriaAzerbaijanBahamas, TheBahrainBangladeshBarbadosBelarusBelgiumBelizeBeninBermudaBhutanBoliviaBosnia and HerzegovinaBotswanaBrazilBrunei DarussalamBulgariaBurkina FasoBurundiCabo VerdeCambodiaCameroonCanadaCaribbean small statesCentral African RepublicCentral Europe and the BalticsChadChileChinaColombiaComorosCongo, Dem. Rep.Congo, Rep.Costa RicaCote d'IvoireCroatiaCuracaoCyprusCzech RepublicDenmarkDjiboutiDominicaDominican RepublicEarly-demographic dividendEast Asia & PacificEast Asia & Pacific (excluding high income)East Asia & Pacific (IDA & IBRD countries)EcuadorEgypt, Arab Rep.El SalvadorEquatorial GuineaEritreaEstoniaEthiopiaEuro areaEurope & Central AsiaEurope & Central Asia (excluding high income)Europe & Central Asia (IDA & IBRD countries)European UnionFaroe IslandsFijiFinlandFragile and conflict affected situationsFranceFrench PolynesiaGabonGambia, TheGeorgiaGermanyGhanaGreeceGrenadaGuatemalaGuineaGuinea-BissauGuyanaHaitiHeavily indebted poor countries (HIPC)High incomeHondurasHong Kong SAR, ChinaHungaryIBRD onlyIcelandIDA & IBRD totalIDA blendIDA onlyIDA totalIndiaIndonesiaIran, Islamic Rep.IraqIrelandIsraelItalyJamaicaJapanJordanKazakhstanKenyaKiribatiKorea, Rep.KosovoKuwaitKyrgyz RepublicLao PDRLate-demographic dividendLatin America & Caribbean Latin America & Caribbean (excluding high income)Latin America & the Caribbean (IDA & IBRD countries)LatviaLeast developed countries: UN classificationLebanonLesothoLiberiaLibyaLithuaniaLow & middle incomeLow incomeLower middle incomeLuxembourgMacao SAR, ChinaMacedonia, FYRMadagascarMalawiMalaysiaMaldivesMaliMaltaMarshall IslandsMauritaniaMauritiusMexicoMicronesia, Fed. Sts.Middle East & North AfricaMiddle East & North Africa (excluding high income)Middle East & North Africa (IDA & IBRD countries)Middle incomeMoldovaMongoliaMontenegroMoroccoMozambiqueMyanmarNamibiaNepalNetherlandsNew CaledoniaNew ZealandNicaraguaNigerNigeriaNorth AmericaNorwayOECD membersOmanOther small statesPacific island small statesPakistanPalauPanamaPapua New GuineaParaguayPeruPhilippinesPolandPortugalPost-demographic dividendPre-demographic dividendQatarRomaniaRussian FederationRwandaSamoaSao Tome and PrincipeSaudi ArabiaSenegalSerbiaSeychellesSierra LeoneSingaporeSint Maarten (Dutch part)Slovak RepublicSloveniaSmall statesSolomon IslandsSouth AfricaSouth AsiaSouth Asia (IDA & IBRD)South SudanSpainSri LankaSt. Kitts and NevisSt. LuciaSt. Vincent and the GrenadinesSub-Saharan Africa Sub-Saharan Africa (excluding high income)Sub-Saharan Africa (IDA & IBRD countries)SudanSurinameSwazilandSwedenSwitzerlandSyrian Arab RepublicTajikistanTanzaniaThailandTimor-LesteTogoTongaTrinidad and TobagoTunisiaTurkeyTuvaluUgandaUkraineUnited KingdomUnited StatesUpper middle incomeUruguayVanuatuVenezuela, RBVietnamWest Bank and GazaWorldYemen, Rep.ZambiaZimbabwe Timeline:
This timeline shows a graph from 1985 to 2015 of Least developed countries: UN classification. No data until 1984. Number of actual observations by date: 24.
Source name:
World Development Indicators
Source organization:
International Monetary Fund, Balance of Payments Statistics Yearbook and data files.
Categories, topics:
Economy & Growth
Last updated:
apr 23, 2017
Indicators value changes by year
Minimum:
1.549 bln
jan 1, 1985
Maximum:
32.213 bln
jan 1, 2014
At the date of observation
Value
Absolute change
Change from previous value
jan 1, 1985
1.549 bln
+1.549 bln
0.0%
jan 1, 1986
1.945 bln
+396.241 mln
25.58%
jan 1, 1987
2.177 bln
+231.383 mln
11.89%
jan 1, 1988
2.45 bln
+273.1 mln
12.55%
jan 1, 1989
3.109 bln
+659.278 mln
26.91%
jan 1, 1990
3.199 bln
+89.556 mln
2.88%
jan 1, 1991
3.295 bln
+95.866 mln
3.0%
jan 1, 1992
3.789 bln
+494.785 mln
15.02%
jan 1, 1993
2.714 bln
-1.076 bln
-28.39%
jan 1, 1994
2.373 bln
-341.027 mln
-12.57%
jan 1, 1995
2.348 bln
-24.683 mln
-1.04%
jan 1, 1998
2.917 bln
+569.015 mln
24.24%
jan 1, 2004
5.992 bln
+3.075 bln
105.41%
jan 1, 2005
7.933 bln
+1.941 bln
32.4%
jan 1, 2006
13.589 bln
+5.656 bln
71.3%
jan 1, 2007
19.002 bln
+5.413 bln
39.83%
jan 1, 2008
21.919 bln
+2.917 bln
15.35%
jan 1, 2009
31.325 bln
+9.406 bln
42.91%
jan 1, 2010
21.436 bln
-9.889 bln
-31.57%
jan 1, 2011
25.317 bln
+3.881 bln
18.11%
jan 1, 2012
28.329 bln
+3.012 bln
11.9%
jan 1, 2013
26.871 bln
-1.458 bln
-5.15%
jan 1, 2014
32.213 bln
+5.342 bln
19.88%
jan 1, 2015
28.907 bln
-3.306 bln
-10.26%
Ranking of countries by current statistics by years


Comments: