29
/
en
AIzaSyAYiBZKx7MnpbEhh9jyipgxe19OcubqV5w
April 1, 2024
238676
Seychelles
SYC
true
2
1
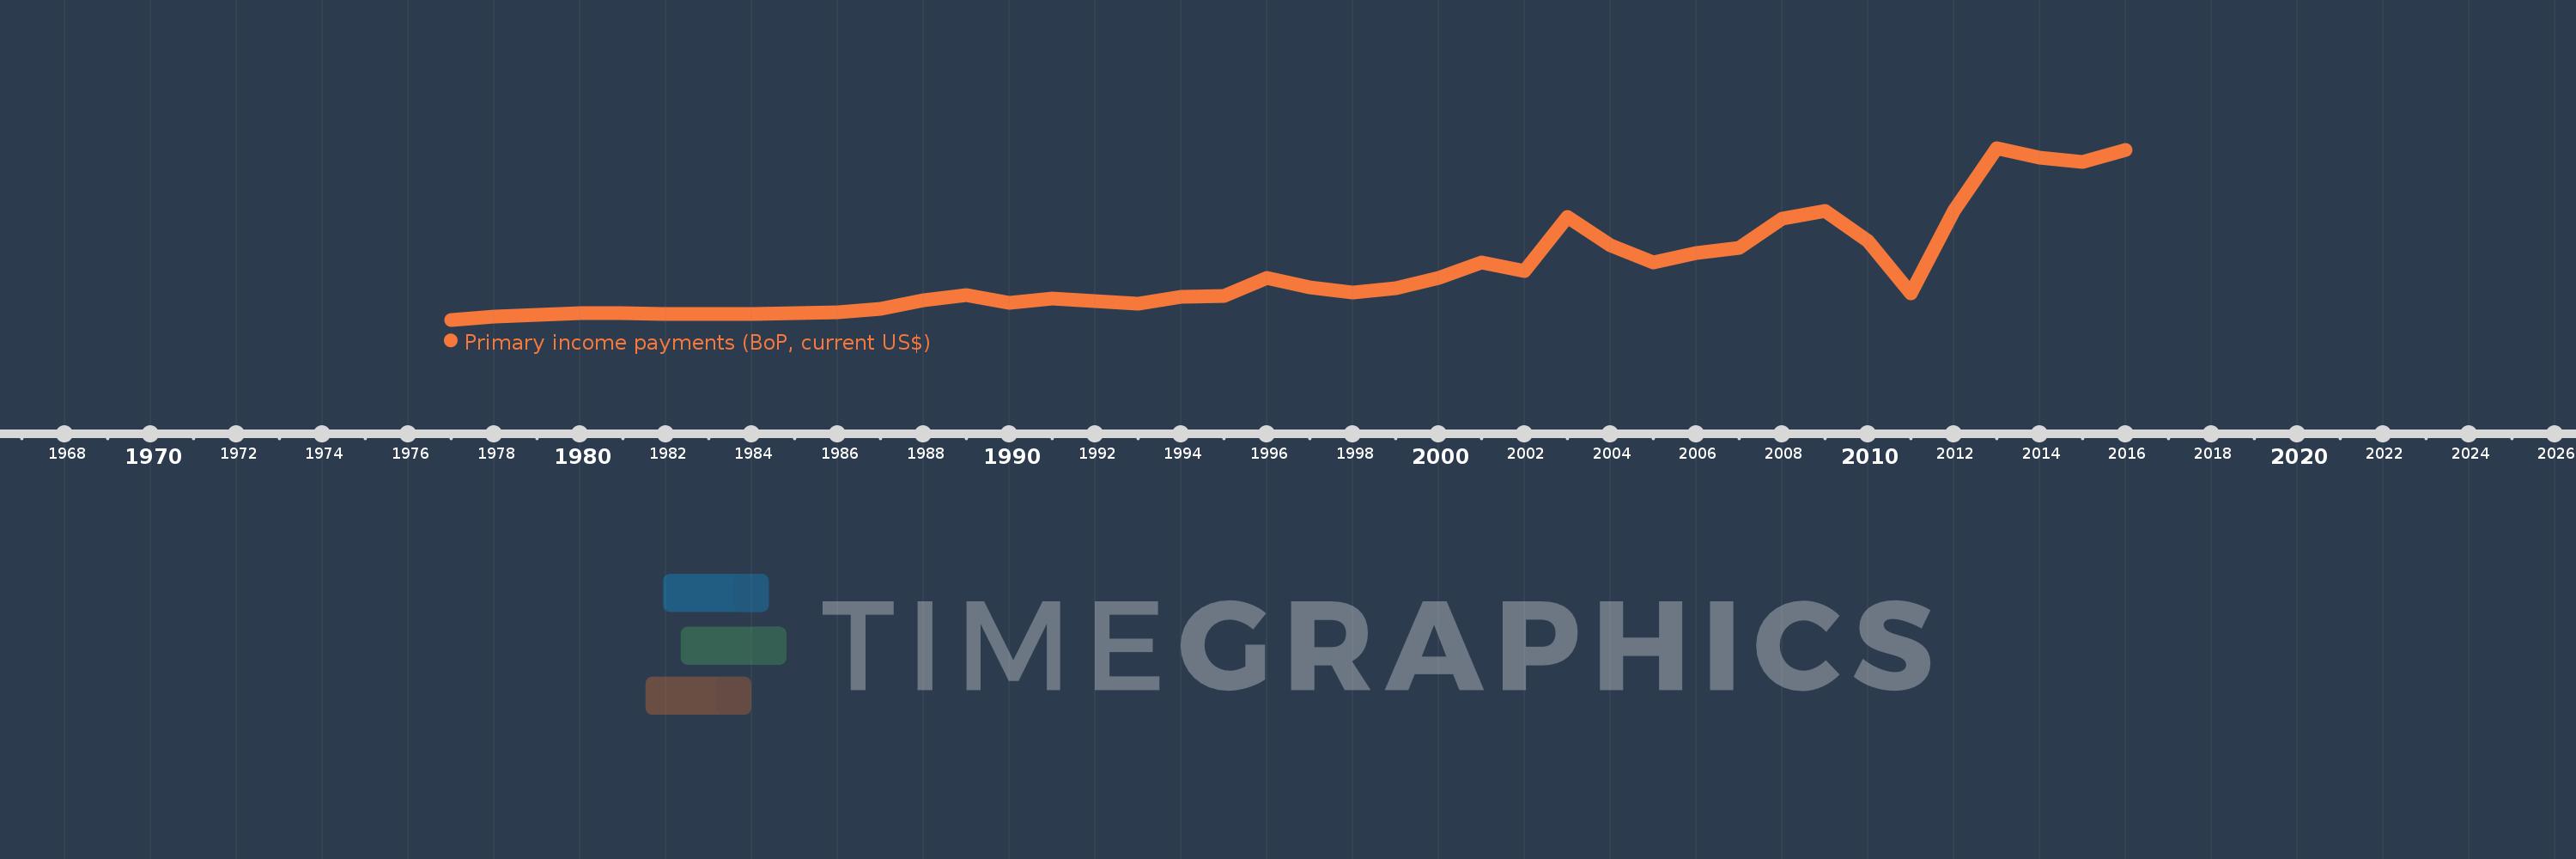
Primary income payments (BoP, current US$)
2016,2015,2014,2013,2012,2011,2010,2009,2008,2007,2006,2005,2004,2003,2002,2001,2000,1999,1998,1997,1996,1995,1994,1993,1992,1991,1990,1989,1988,1987,1986,1985,1984,1983,1982,1981,1980,1979,1978,1977
This statistics in other country:
AfghanistanAlbaniaAlgeriaAngolaAntigua and BarbudaArab WorldArgentinaArmeniaArubaAustraliaAustriaAzerbaijanBahamas, TheBahrainBangladeshBarbadosBelarusBelgiumBelizeBeninBermudaBhutanBoliviaBosnia and HerzegovinaBotswanaBrazilBrunei DarussalamBulgariaBurkina FasoBurundiCabo VerdeCambodiaCameroonCanadaCaribbean small statesCentral African RepublicCentral Europe and the BalticsChadChileChinaColombiaComorosCongo, Dem. Rep.Congo, Rep.Costa RicaCote d'IvoireCroatiaCuracaoCyprusCzech RepublicDenmarkDjiboutiDominicaDominican RepublicEarly-demographic dividendEast Asia & PacificEast Asia & Pacific (excluding high income)East Asia & Pacific (IDA & IBRD countries)EcuadorEgypt, Arab Rep.El SalvadorEquatorial GuineaEritreaEstoniaEthiopiaEuro areaEurope & Central AsiaEurope & Central Asia (excluding high income)Europe & Central Asia (IDA & IBRD countries)European UnionFaroe IslandsFijiFinlandFragile and conflict affected situationsFranceFrench PolynesiaGabonGambia, TheGeorgiaGermanyGhanaGreeceGrenadaGuatemalaGuineaGuinea-BissauGuyanaHaitiHeavily indebted poor countries (HIPC)High incomeHondurasHong Kong SAR, ChinaHungaryIBRD onlyIcelandIDA & IBRD totalIDA blendIDA onlyIDA totalIndiaIndonesiaIran, Islamic Rep.IraqIrelandIsraelItalyJamaicaJapanJordanKazakhstanKenyaKiribatiKorea, Rep.KosovoKuwaitKyrgyz RepublicLao PDRLate-demographic dividendLatin America & Caribbean Latin America & Caribbean (excluding high income)Latin America & the Caribbean (IDA & IBRD countries)LatviaLeast developed countries: UN classificationLebanonLesothoLiberiaLibyaLithuaniaLow & middle incomeLow incomeLower middle incomeLuxembourgMacao SAR, ChinaMacedonia, FYRMadagascarMalawiMalaysiaMaldivesMaliMaltaMarshall IslandsMauritaniaMauritiusMexicoMicronesia, Fed. Sts.Middle East & North AfricaMiddle East & North Africa (excluding high income)Middle East & North Africa (IDA & IBRD countries)Middle incomeMoldovaMongoliaMontenegroMoroccoMozambiqueMyanmarNamibiaNepalNetherlandsNew CaledoniaNew ZealandNicaraguaNigerNigeriaNorth AmericaNorwayOECD membersOmanOther small statesPacific island small statesPakistanPalauPanamaPapua New GuineaParaguayPeruPhilippinesPolandPortugalPost-demographic dividendPre-demographic dividendQatarRomaniaRussian FederationRwandaSamoaSao Tome and PrincipeSaudi ArabiaSenegalSerbiaSeychellesSierra LeoneSingaporeSint Maarten (Dutch part)Slovak RepublicSloveniaSmall statesSolomon IslandsSouth AfricaSouth AsiaSouth Asia (IDA & IBRD)South SudanSpainSri LankaSt. Kitts and NevisSt. LuciaSt. Vincent and the GrenadinesSub-Saharan Africa Sub-Saharan Africa (excluding high income)Sub-Saharan Africa (IDA & IBRD countries)SudanSurinameSwazilandSwedenSwitzerlandSyrian Arab RepublicTajikistanTanzaniaThailandTimor-LesteTogoTongaTrinidad and TobagoTunisiaTurkeyTuvaluUgandaUkraineUnited KingdomUnited StatesUpper middle incomeUruguayVanuatuVenezuela, RBVietnamWest Bank and GazaWorldYemen, Rep.ZambiaZimbabwe Timeline:
This timeline shows a graph from 1977 to 2016 of Seychelles. No data until 1976. Number of actual observations by date: 40.
Source name:
World Development Indicators
Source organization:
International Monetary Fund, Balance of Payments Statistics Yearbook and data files.
Categories, topics:
Economy & Growth
Last updated:
apr 23, 2017
Indicators value changes by year
Minimum:
2.871 mln
jan 1, 1977
Maximum:
124.16 mln
jan 1, 2013
At the date of observation
Value
Absolute change
Change from previous value
jan 1, 1977
2.871 mln
+2.871 mln
0.0%
jan 1, 1978
4.972 mln
+2.101 mln
73.16%
jan 1, 1979
6.041 mln
+1.069 mln
21.51%
jan 1, 1980
7.64 mln
+1.598 mln
26.46%
jan 1, 1981
7.679 mln
+39.306K
0.51%
jan 1, 1982
6.881 mln
-797.478K
-10.39%
jan 1, 1983
6.721 mln
-160.06K
-2.33%
jan 1, 1984
7.117 mln
+396.208K
5.89%
jan 1, 1985
7.818 mln
+700.627K
9.84%
jan 1, 1986
8.09 mln
+272.269K
3.48%
jan 1, 1987
10.554 mln
+2.464 mln
30.46%
jan 1, 1988
16.674 mln
+6.119 mln
57.98%
jan 1, 1989
20.528 mln
+3.854 mln
23.12%
jan 1, 1990
14.864 mln
-5.664 mln
-27.59%
jan 1, 1991
17.771 mln
+2.907 mln
19.56%
jan 1, 1992
15.837 mln
-1.934 mln
-10.88%
jan 1, 1993
14.455 mln
-1.382 mln
-8.72%
jan 1, 1994
19.087 mln
+4.632 mln
32.04%
jan 1, 1995
19.838 mln
+751.358K
3.94%
jan 1, 1996
32.214 mln
+12.375 mln
62.38%
jan 1, 1997
25.524 mln
-6.689 mln
-20.77%
jan 1, 1998
21.924 mln
-3.6 mln
-14.11%
jan 1, 1999
25.306 mln
+3.382 mln
15.43%
jan 1, 2000
32.292 mln
+6.986 mln
27.61%
jan 1, 2001
43.405 mln
+11.113 mln
34.41%
jan 1, 2002
37.485 mln
-5.921 mln
-13.64%
jan 1, 2003
75.432 mln
+37.947 mln
101.23%
jan 1, 2004
55.178 mln
-20.253 mln
-26.85%
jan 1, 2005
43.125 mln
-12.053 mln
-21.84%
jan 1, 2006
49.877 mln
+6.752 mln
15.66%
jan 1, 2007
53.891 mln
+4.014 mln
8.05%
jan 1, 2008
74.428 mln
+20.537 mln
38.11%
jan 1, 2009
80.006 mln
+5.578 mln
7.49%
jan 1, 2010
58.364 mln
-21.641 mln
-27.05%
jan 1, 2011
21.731 mln
-36.633 mln
-62.77%
jan 1, 2012
79.407 mln
+57.676 mln
265.41%
jan 1, 2013
124.16 mln
+44.753 mln
56.36%
jan 1, 2014
117.567 mln
-6.594 mln
-5.31%
jan 1, 2015
114.54 mln
-3.027 mln
-2.57%
jan 1, 2016
122.772 mln
+8.233 mln
7.19%
Ranking of countries by current statistics by years


Comments: