29
/
en
AIzaSyAYiBZKx7MnpbEhh9jyipgxe19OcubqV5w
April 1, 2024
236395
Senegal
SEN
true
2
1
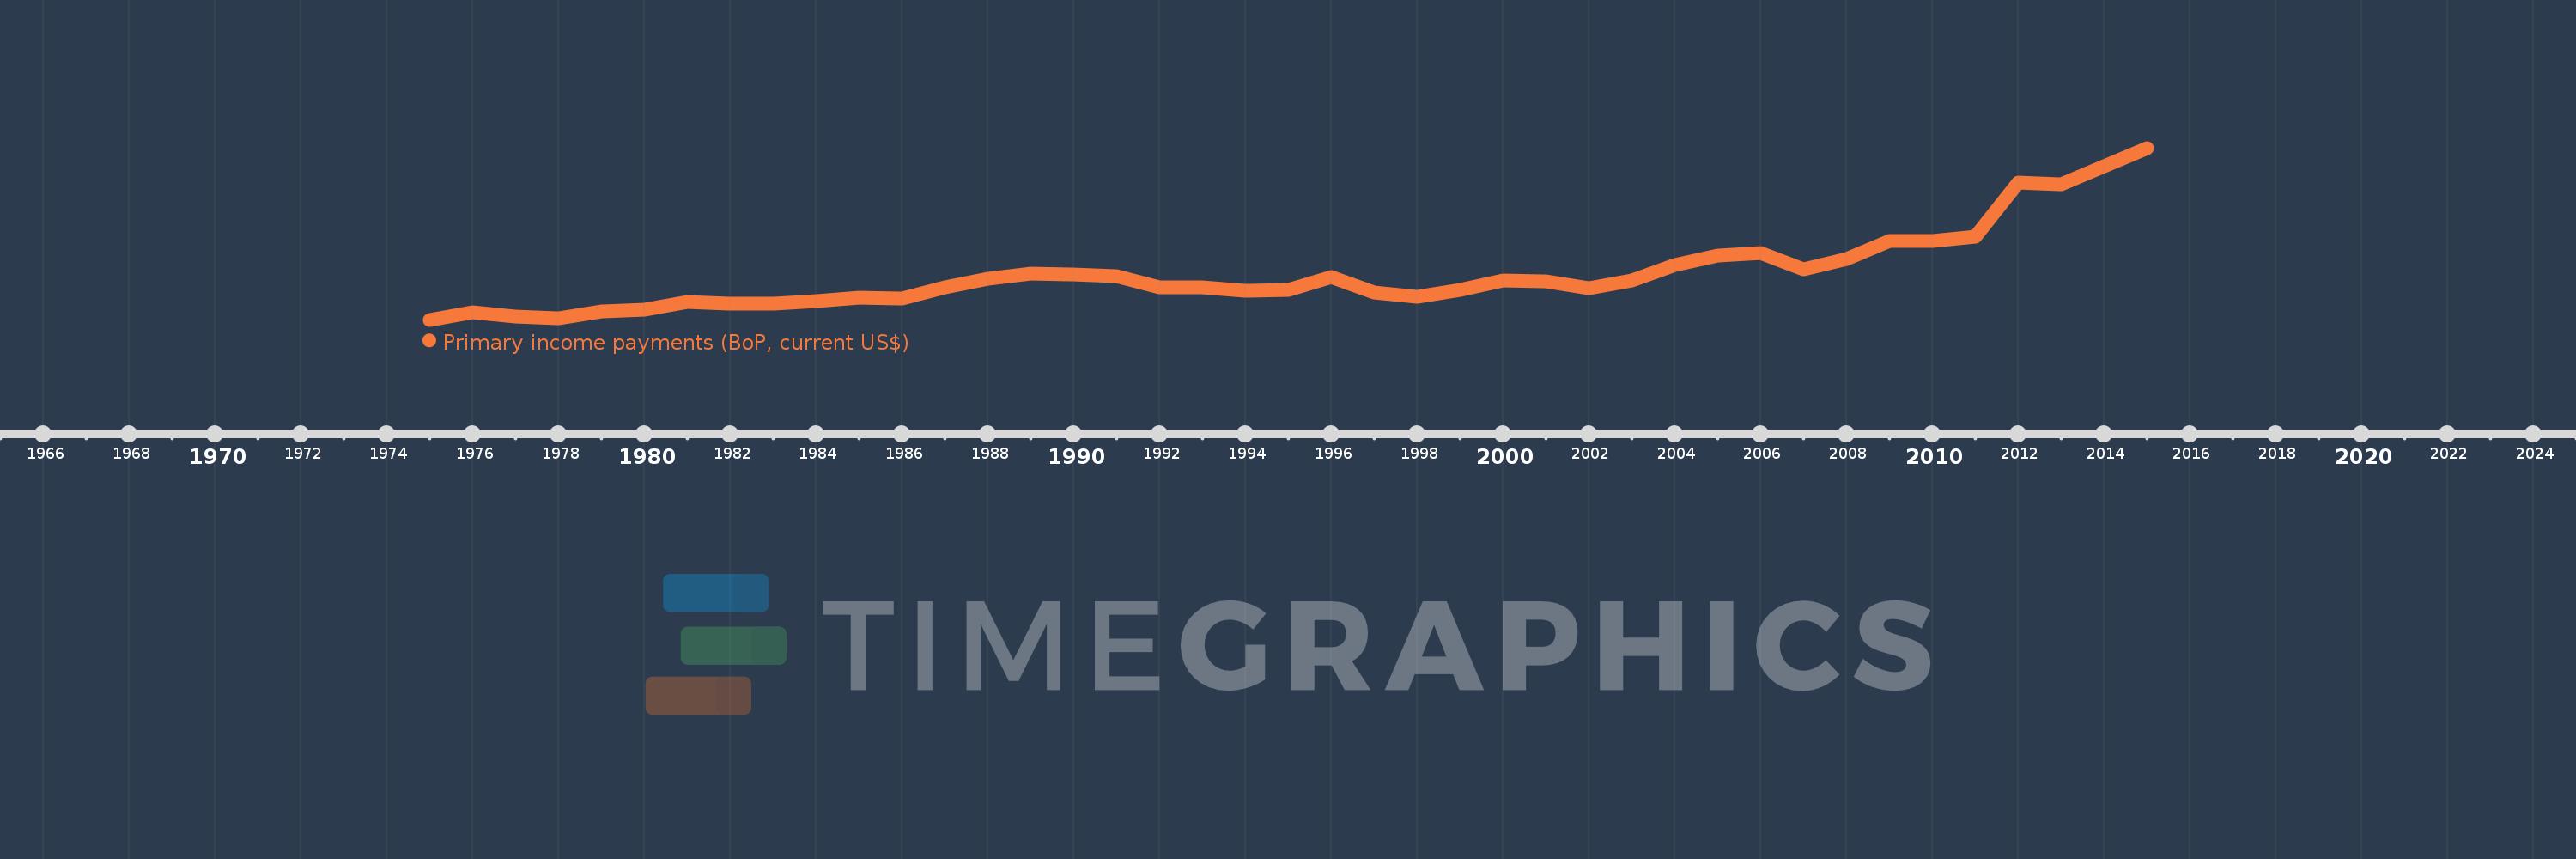
Primary income payments (BoP, current US$)
2015,2014,2013,2012,2011,2010,2009,2008,2007,2006,2005,2004,2003,2002,2001,2000,1999,1998,1997,1996,1995,1994,1993,1992,1991,1990,1989,1988,1987,1986,1985,1984,1983,1982,1981,1980,1979,1978,1977,1976,1975
This statistics in other country:
AfghanistanAlbaniaAlgeriaAngolaAntigua and BarbudaArab WorldArgentinaArmeniaArubaAustraliaAustriaAzerbaijanBahamas, TheBahrainBangladeshBarbadosBelarusBelgiumBelizeBeninBermudaBhutanBoliviaBosnia and HerzegovinaBotswanaBrazilBrunei DarussalamBulgariaBurkina FasoBurundiCabo VerdeCambodiaCameroonCanadaCaribbean small statesCentral African RepublicCentral Europe and the BalticsChadChileChinaColombiaComorosCongo, Dem. Rep.Congo, Rep.Costa RicaCote d'IvoireCroatiaCuracaoCyprusCzech RepublicDenmarkDjiboutiDominicaDominican RepublicEarly-demographic dividendEast Asia & PacificEast Asia & Pacific (excluding high income)East Asia & Pacific (IDA & IBRD countries)EcuadorEgypt, Arab Rep.El SalvadorEquatorial GuineaEritreaEstoniaEthiopiaEuro areaEurope & Central AsiaEurope & Central Asia (excluding high income)Europe & Central Asia (IDA & IBRD countries)European UnionFaroe IslandsFijiFinlandFragile and conflict affected situationsFranceFrench PolynesiaGabonGambia, TheGeorgiaGermanyGhanaGreeceGrenadaGuatemalaGuineaGuinea-BissauGuyanaHaitiHeavily indebted poor countries (HIPC)High incomeHondurasHong Kong SAR, ChinaHungaryIBRD onlyIcelandIDA & IBRD totalIDA blendIDA onlyIDA totalIndiaIndonesiaIran, Islamic Rep.IraqIrelandIsraelItalyJamaicaJapanJordanKazakhstanKenyaKiribatiKorea, Rep.KosovoKuwaitKyrgyz RepublicLao PDRLate-demographic dividendLatin America & Caribbean Latin America & Caribbean (excluding high income)Latin America & the Caribbean (IDA & IBRD countries)LatviaLeast developed countries: UN classificationLebanonLesothoLiberiaLibyaLithuaniaLow & middle incomeLow incomeLower middle incomeLuxembourgMacao SAR, ChinaMacedonia, FYRMadagascarMalawiMalaysiaMaldivesMaliMaltaMarshall IslandsMauritaniaMauritiusMexicoMicronesia, Fed. Sts.Middle East & North AfricaMiddle East & North Africa (excluding high income)Middle East & North Africa (IDA & IBRD countries)Middle incomeMoldovaMongoliaMontenegroMoroccoMozambiqueMyanmarNamibiaNepalNetherlandsNew CaledoniaNew ZealandNicaraguaNigerNigeriaNorth AmericaNorwayOECD membersOmanOther small statesPacific island small statesPakistanPalauPanamaPapua New GuineaParaguayPeruPhilippinesPolandPortugalPost-demographic dividendPre-demographic dividendQatarRomaniaRussian FederationRwandaSamoaSao Tome and PrincipeSaudi ArabiaSenegalSerbiaSeychellesSierra LeoneSingaporeSint Maarten (Dutch part)Slovak RepublicSloveniaSmall statesSolomon IslandsSouth AfricaSouth AsiaSouth Asia (IDA & IBRD)South SudanSpainSri LankaSt. Kitts and NevisSt. LuciaSt. Vincent and the GrenadinesSub-Saharan Africa Sub-Saharan Africa (excluding high income)Sub-Saharan Africa (IDA & IBRD countries)SudanSurinameSwazilandSwedenSwitzerlandSyrian Arab RepublicTajikistanTanzaniaThailandTimor-LesteTogoTongaTrinidad and TobagoTunisiaTurkeyTuvaluUgandaUkraineUnited KingdomUnited StatesUpper middle incomeUruguayVanuatuVenezuela, RBVietnamWest Bank and GazaWorldYemen, Rep.ZambiaZimbabwe Timeline:
This timeline shows a graph from 1975 to 2015 of Senegal. No data until 1974. Number of actual observations by date: 41.
Source name:
World Development Indicators
Source organization:
International Monetary Fund, Balance of Payments Statistics Yearbook and data files.
Categories, topics:
Economy & Growth
Last updated:
apr 23, 2017
Indicators value changes by year
Minimum:
58.62 mln
jan 1, 1975
Maximum:
672.426 mln
jan 1, 2015
At the date of observation
Value
Absolute change
Change from previous value
jan 1, 1975
58.62 mln
+58.62 mln
0.0%
jan 1, 1976
83.849 mln
+25.23 mln
43.04%
jan 1, 1977
68.592 mln
-15.258 mln
-18.2%
jan 1, 1978
63.945 mln
-4.647 mln
-6.77%
jan 1, 1979
87.567 mln
+23.622 mln
36.94%
jan 1, 1980
95.618 mln
+8.051 mln
9.19%
jan 1, 1981
122.018 mln
+26.401 mln
27.61%
jan 1, 1982
115.85 mln
-6.169 mln
-5.06%
jan 1, 1983
117.04 mln
+1.19 mln
1.03%
jan 1, 1984
123.916 mln
+6.876 mln
5.87%
jan 1, 1985
138.275 mln
+14.359 mln
11.59%
jan 1, 1986
133.886 mln
-4.389 mln
-3.17%
jan 1, 1987
173.633 mln
+39.747 mln
29.69%
jan 1, 1988
205.1 mln
+31.467 mln
18.12%
jan 1, 1989
222.328 mln
+17.228 mln
8.4%
jan 1, 1990
219.493 mln
-2.835 mln
-1.28%
jan 1, 1991
213.285 mln
-6.208 mln
-2.83%
jan 1, 1992
175.855 mln
-37.43 mln
-17.55%
jan 1, 1993
173.031 mln
-2.824 mln
-1.61%
jan 1, 1994
162.274 mln
-10.757 mln
-6.22%
jan 1, 1995
164.48 mln
+2.206 mln
1.36%
jan 1, 1996
211.522 mln
+47.042 mln
28.6%
jan 1, 1997
154.463 mln
-57.059 mln
-26.98%
jan 1, 1998
139.416 mln
-15.047 mln
-9.74%
jan 1, 1999
164.369 mln
+24.953 mln
17.9%
jan 1, 2000
199.122 mln
+34.752 mln
21.14%
jan 1, 2001
196.674 mln
-2.448 mln
-1.23%
jan 1, 2002
171.924 mln
-24.75 mln
-12.58%
jan 1, 2003
197.345 mln
+25.421 mln
14.79%
jan 1, 2004
255.542 mln
+58.197 mln
29.49%
jan 1, 2005
287.453 mln
+31.911 mln
12.49%
jan 1, 2006
296.454 mln
+9.001 mln
3.13%
jan 1, 2007
238.769 mln
-57.685 mln
-19.46%
jan 1, 2008
275.442 mln
+36.672 mln
15.36%
jan 1, 2009
338.518 mln
+63.076 mln
22.9%
jan 1, 2010
341.052 mln
+2.534 mln
0.75%
jan 1, 2011
355.518 mln
+14.466 mln
4.24%
jan 1, 2012
548.946 mln
+193.428 mln
54.41%
jan 1, 2013
543.806 mln
-5.14 mln
-0.94%
jan 1, 2014
607.524 mln
+63.718 mln
11.72%
jan 1, 2015
672.426 mln
+64.902 mln
10.68%
Ranking of countries by current statistics by years


Comments: