29
/
en
AIzaSyAYiBZKx7MnpbEhh9jyipgxe19OcubqV5w
April 1, 2024
278185
Uruguay
URY
true
2
1
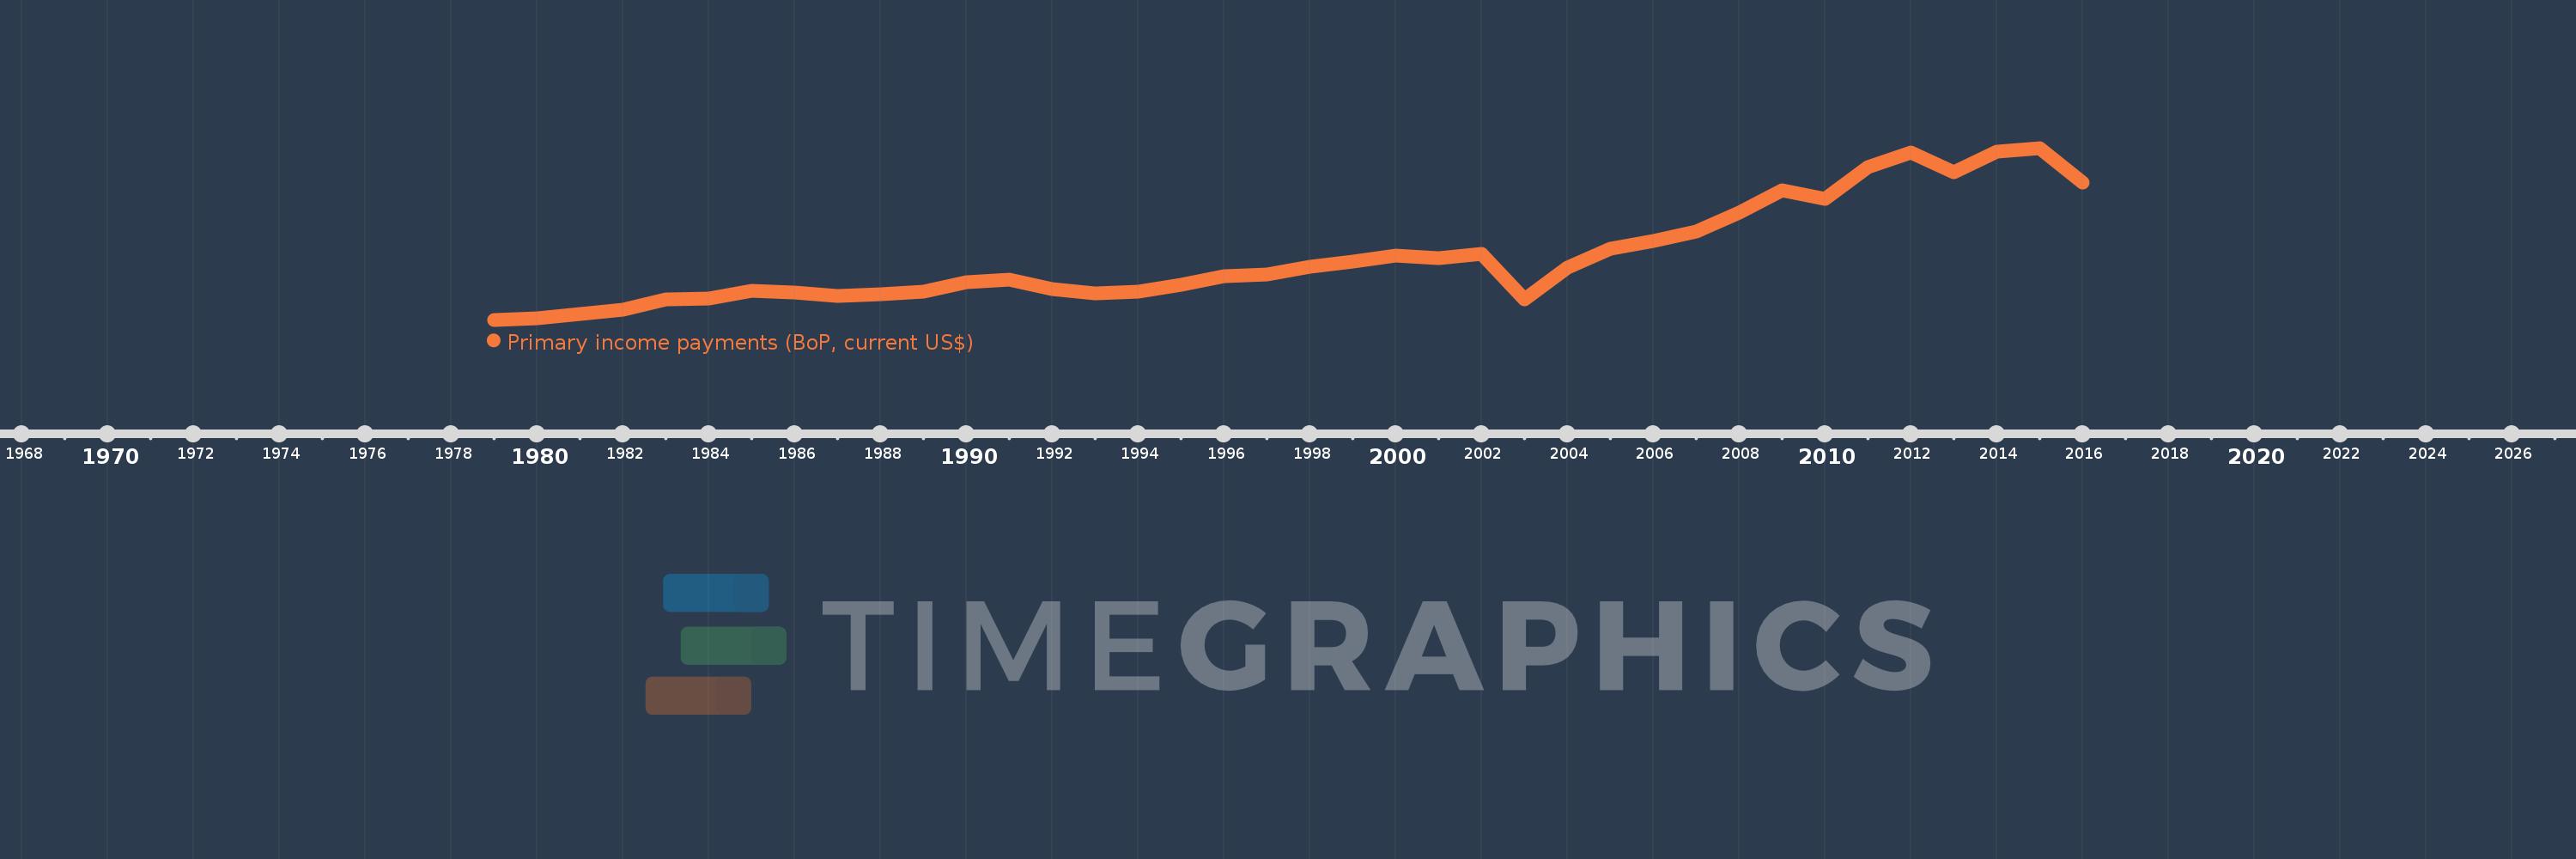
Primary income payments (BoP, current US$)
2016,2015,2014,2013,2012,2011,2010,2009,2008,2007,2006,2005,2004,2003,2002,2001,2000,1999,1998,1997,1996,1995,1994,1993,1992,1991,1990,1989,1988,1987,1986,1985,1984,1983,1982,1981,1980,1979
This statistics in other country:
AfghanistanAlbaniaAlgeriaAngolaAntigua and BarbudaArab WorldArgentinaArmeniaArubaAustraliaAustriaAzerbaijanBahamas, TheBahrainBangladeshBarbadosBelarusBelgiumBelizeBeninBermudaBhutanBoliviaBosnia and HerzegovinaBotswanaBrazilBrunei DarussalamBulgariaBurkina FasoBurundiCabo VerdeCambodiaCameroonCanadaCaribbean small statesCentral African RepublicCentral Europe and the BalticsChadChileChinaColombiaComorosCongo, Dem. Rep.Congo, Rep.Costa RicaCote d'IvoireCroatiaCuracaoCyprusCzech RepublicDenmarkDjiboutiDominicaDominican RepublicEarly-demographic dividendEast Asia & PacificEast Asia & Pacific (excluding high income)East Asia & Pacific (IDA & IBRD countries)EcuadorEgypt, Arab Rep.El SalvadorEquatorial GuineaEritreaEstoniaEthiopiaEuro areaEurope & Central AsiaEurope & Central Asia (excluding high income)Europe & Central Asia (IDA & IBRD countries)European UnionFaroe IslandsFijiFinlandFragile and conflict affected situationsFranceFrench PolynesiaGabonGambia, TheGeorgiaGermanyGhanaGreeceGrenadaGuatemalaGuineaGuinea-BissauGuyanaHaitiHeavily indebted poor countries (HIPC)High incomeHondurasHong Kong SAR, ChinaHungaryIBRD onlyIcelandIDA & IBRD totalIDA blendIDA onlyIDA totalIndiaIndonesiaIran, Islamic Rep.IraqIrelandIsraelItalyJamaicaJapanJordanKazakhstanKenyaKiribatiKorea, Rep.KosovoKuwaitKyrgyz RepublicLao PDRLate-demographic dividendLatin America & Caribbean Latin America & Caribbean (excluding high income)Latin America & the Caribbean (IDA & IBRD countries)LatviaLeast developed countries: UN classificationLebanonLesothoLiberiaLibyaLithuaniaLow & middle incomeLow incomeLower middle incomeLuxembourgMacao SAR, ChinaMacedonia, FYRMadagascarMalawiMalaysiaMaldivesMaliMaltaMarshall IslandsMauritaniaMauritiusMexicoMicronesia, Fed. Sts.Middle East & North AfricaMiddle East & North Africa (excluding high income)Middle East & North Africa (IDA & IBRD countries)Middle incomeMoldovaMongoliaMontenegroMoroccoMozambiqueMyanmarNamibiaNepalNetherlandsNew CaledoniaNew ZealandNicaraguaNigerNigeriaNorth AmericaNorwayOECD membersOmanOther small statesPacific island small statesPakistanPalauPanamaPapua New GuineaParaguayPeruPhilippinesPolandPortugalPost-demographic dividendPre-demographic dividendQatarRomaniaRussian FederationRwandaSamoaSao Tome and PrincipeSaudi ArabiaSenegalSerbiaSeychellesSierra LeoneSingaporeSint Maarten (Dutch part)Slovak RepublicSloveniaSmall statesSolomon IslandsSouth AfricaSouth AsiaSouth Asia (IDA & IBRD)South SudanSpainSri LankaSt. Kitts and NevisSt. LuciaSt. Vincent and the GrenadinesSub-Saharan Africa Sub-Saharan Africa (excluding high income)Sub-Saharan Africa (IDA & IBRD countries)SudanSurinameSwazilandSwedenSwitzerlandSyrian Arab RepublicTajikistanTanzaniaThailandTimor-LesteTogoTongaTrinidad and TobagoTunisiaTurkeyTuvaluUgandaUkraineUnited KingdomUnited StatesUpper middle incomeUruguayVanuatuVenezuela, RBVietnamWest Bank and GazaWorldYemen, Rep.ZambiaZimbabwe Timeline:
This timeline shows a graph from 1979 to 2016 of Uruguay. No data until 1978. Number of actual observations by date: 38.
Source name:
World Development Indicators
Source organization:
International Monetary Fund, Balance of Payments Statistics Yearbook and data files.
Categories, topics:
Economy & Growth
Last updated:
apr 23, 2017
Indicators value changes by year
Minimum:
95.2 mln
jan 1, 1979
Maximum:
2.191 bln
jan 1, 2015
At the date of observation
Value
Absolute change
Change from previous value
jan 1, 1979
95.2 mln
+95.2 mln
0.0%
jan 1, 1980
109.1 mln
+13.9 mln
14.6%
jan 1, 1981
167.8 mln
+58.7 mln
53.8%
jan 1, 1982
219.6 mln
+51.8 mln
30.87%
jan 1, 1983
344.0 mln
+124.4 mln
56.65%
jan 1, 1984
358.5 mln
+14.5 mln
4.22%
jan 1, 1985
448.8 mln
+90.3 mln
25.19%
jan 1, 1986
428.3 mln
-20.5 mln
-4.57%
jan 1, 1987
384.4 mln
-43.9 mln
-10.25%
jan 1, 1988
405.3 mln
+20.9 mln
5.44%
jan 1, 1989
439.0 mln
+33.7 mln
8.31%
jan 1, 1990
552.1 mln
+113.1 mln
25.76%
jan 1, 1991
579.6 mln
+27.5 mln
4.98%
jan 1, 1992
467.1 mln
-112.5 mln
-19.41%
jan 1, 1993
412.1 mln
-55.0 mln
-11.77%
jan 1, 1994
442.5 mln
+30.4 mln
7.38%
jan 1, 1995
525.1 mln
+82.6 mln
18.67%
jan 1, 1996
631.3 mln
+106.2 mln
20.22%
jan 1, 1997
649.2 mln
+17.9 mln
2.84%
jan 1, 1998
740.0 mln
+90.8 mln
13.99%
jan 1, 1999
805.9 mln
+65.9 mln
8.91%
jan 1, 2000
879.3 mln
+73.4 mln
9.11%
jan 1, 2001
842.234 mln
-37.066 mln
-4.22%
jan 1, 2002
900.665 mln
+58.431 mln
6.94%
jan 1, 2003
344.435 mln
-556.23 mln
-61.76%
jan 1, 2004
730.274 mln
+385.839 mln
112.02%
jan 1, 2005
960.355 mln
+230.081 mln
31.51%
jan 1, 2006
1.057 bln
+96.932 mln
10.09%
jan 1, 2007
1.17 bln
+112.553 mln
10.65%
jan 1, 2008
1.401 bln
+231.088 mln
19.75%
jan 1, 2009
1.674 bln
+273.143 mln
19.5%
jan 1, 2010
1.572 bln
-102.239 mln
-6.11%
jan 1, 2011
1.956 bln
+383.821 mln
24.42%
jan 1, 2012
2.136 bln
+180.559 mln
9.23%
jan 1, 2013
1.893 bln
-243.247 mln
-11.39%
jan 1, 2014
2.151 bln
+257.75 mln
13.62%
jan 1, 2015
2.191 bln
+40.137 mln
1.87%
jan 1, 2016
1.769 bln
-421.467 mln
-19.24%
Ranking of countries by current statistics by years


Comments: