29
/
en
AIzaSyAYiBZKx7MnpbEhh9jyipgxe19OcubqV5w
April 1, 2024
42920
Latin America & Caribbean (excluding high income)
LAC
false
2
1
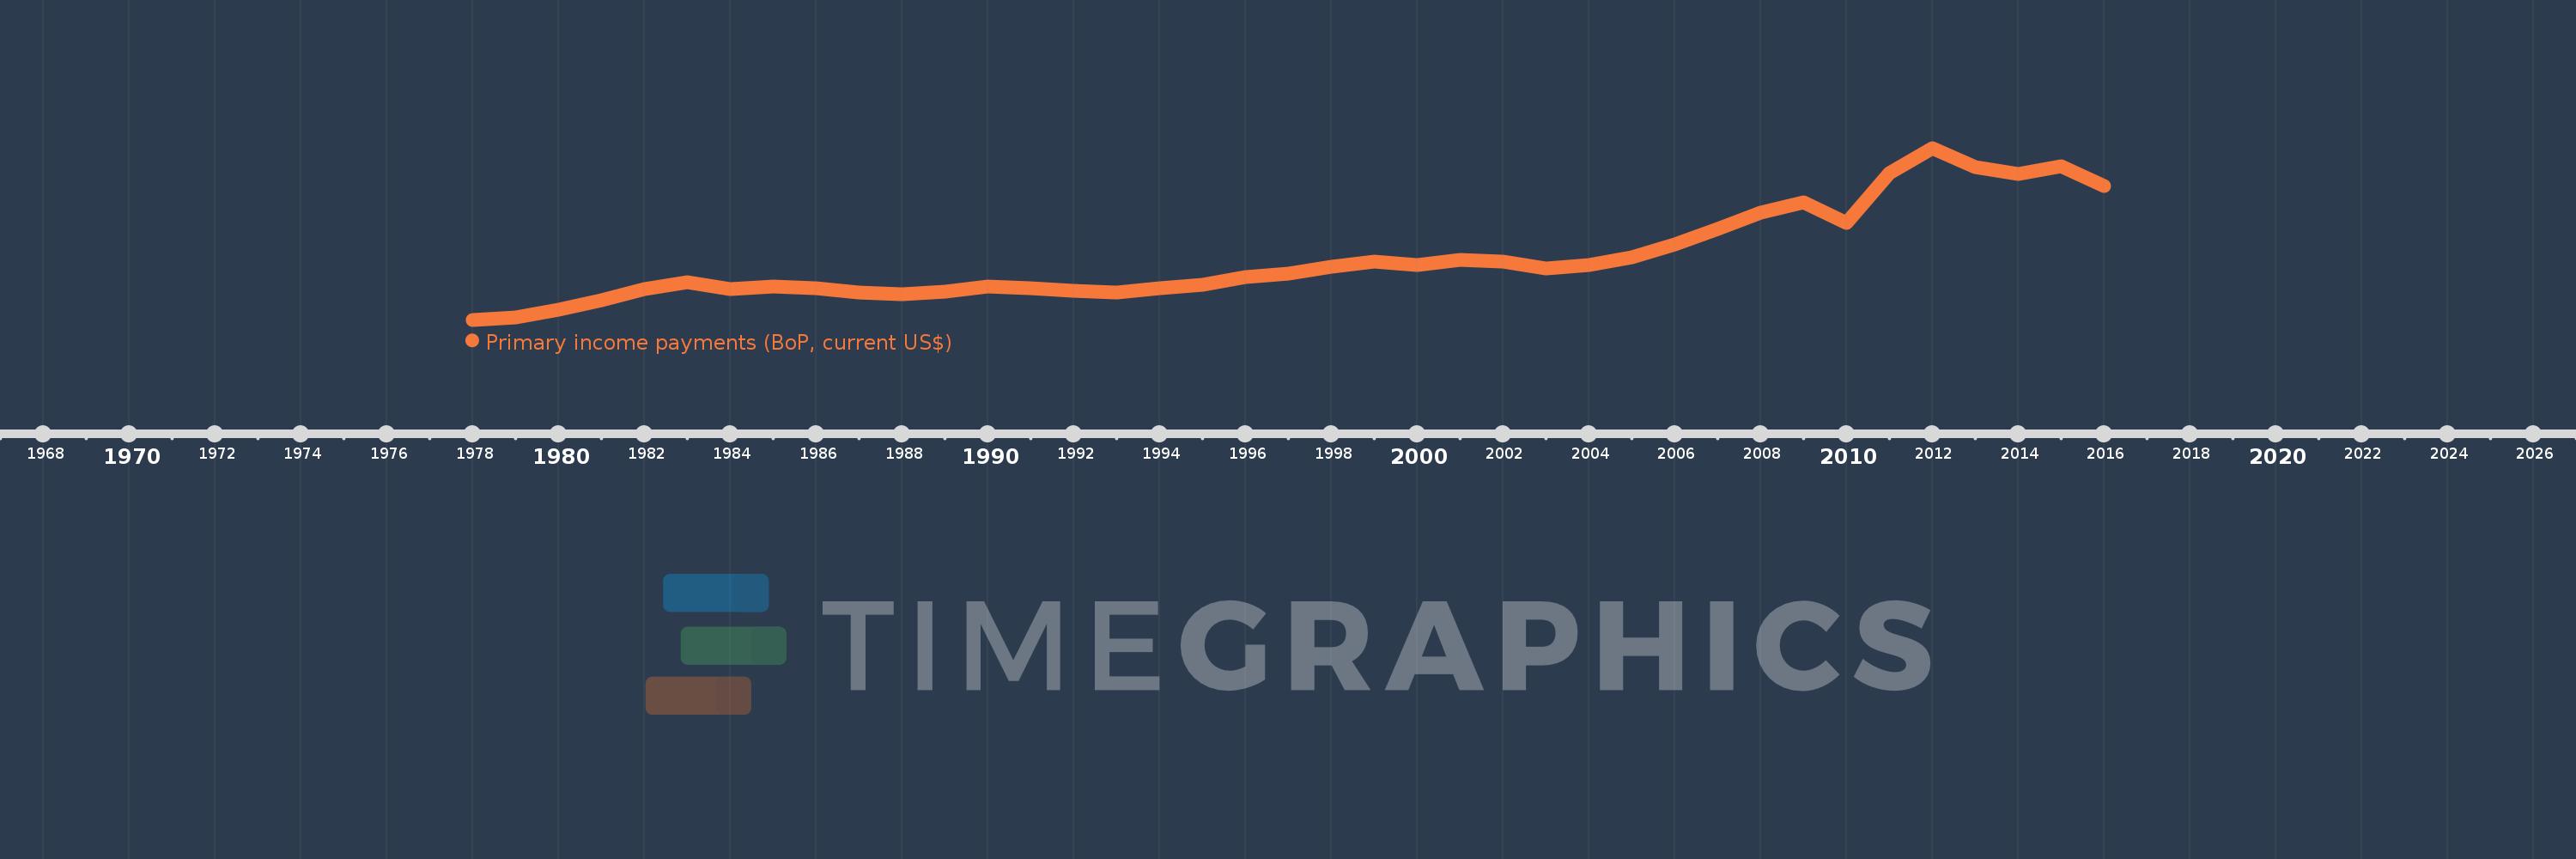
Primary income payments (BoP, current US$)
2016,2015,2014,2013,2012,2011,2010,2009,2008,2007,2006,2005,2004,2003,2002,2001,2000,1999,1998,1997,1996,1995,1994,1993,1992,1991,1990,1989,1988,1987,1986,1985,1984,1983,1982,1981,1980,1979,1978
This statistics in other country:
AfghanistanAlbaniaAlgeriaAngolaAntigua and BarbudaArab WorldArgentinaArmeniaArubaAustraliaAustriaAzerbaijanBahamas, TheBahrainBangladeshBarbadosBelarusBelgiumBelizeBeninBermudaBhutanBoliviaBosnia and HerzegovinaBotswanaBrazilBrunei DarussalamBulgariaBurkina FasoBurundiCabo VerdeCambodiaCameroonCanadaCaribbean small statesCentral African RepublicCentral Europe and the BalticsChadChileChinaColombiaComorosCongo, Dem. Rep.Congo, Rep.Costa RicaCote d'IvoireCroatiaCuracaoCyprusCzech RepublicDenmarkDjiboutiDominicaDominican RepublicEarly-demographic dividendEast Asia & PacificEast Asia & Pacific (excluding high income)East Asia & Pacific (IDA & IBRD countries)EcuadorEgypt, Arab Rep.El SalvadorEquatorial GuineaEritreaEstoniaEthiopiaEuro areaEurope & Central AsiaEurope & Central Asia (excluding high income)Europe & Central Asia (IDA & IBRD countries)European UnionFaroe IslandsFijiFinlandFragile and conflict affected situationsFranceFrench PolynesiaGabonGambia, TheGeorgiaGermanyGhanaGreeceGrenadaGuatemalaGuineaGuinea-BissauGuyanaHaitiHeavily indebted poor countries (HIPC)High incomeHondurasHong Kong SAR, ChinaHungaryIBRD onlyIcelandIDA & IBRD totalIDA blendIDA onlyIDA totalIndiaIndonesiaIran, Islamic Rep.IraqIrelandIsraelItalyJamaicaJapanJordanKazakhstanKenyaKiribatiKorea, Rep.KosovoKuwaitKyrgyz RepublicLao PDRLate-demographic dividendLatin America & Caribbean Latin America & Caribbean (excluding high income)Latin America & the Caribbean (IDA & IBRD countries)LatviaLeast developed countries: UN classificationLebanonLesothoLiberiaLibyaLithuaniaLow & middle incomeLow incomeLower middle incomeLuxembourgMacao SAR, ChinaMacedonia, FYRMadagascarMalawiMalaysiaMaldivesMaliMaltaMarshall IslandsMauritaniaMauritiusMexicoMicronesia, Fed. Sts.Middle East & North AfricaMiddle East & North Africa (excluding high income)Middle East & North Africa (IDA & IBRD countries)Middle incomeMoldovaMongoliaMontenegroMoroccoMozambiqueMyanmarNamibiaNepalNetherlandsNew CaledoniaNew ZealandNicaraguaNigerNigeriaNorth AmericaNorwayOECD membersOmanOther small statesPacific island small statesPakistanPalauPanamaPapua New GuineaParaguayPeruPhilippinesPolandPortugalPost-demographic dividendPre-demographic dividendQatarRomaniaRussian FederationRwandaSamoaSao Tome and PrincipeSaudi ArabiaSenegalSerbiaSeychellesSierra LeoneSingaporeSint Maarten (Dutch part)Slovak RepublicSloveniaSmall statesSolomon IslandsSouth AfricaSouth AsiaSouth Asia (IDA & IBRD)South SudanSpainSri LankaSt. Kitts and NevisSt. LuciaSt. Vincent and the GrenadinesSub-Saharan Africa Sub-Saharan Africa (excluding high income)Sub-Saharan Africa (IDA & IBRD countries)SudanSurinameSwazilandSwedenSwitzerlandSyrian Arab RepublicTajikistanTanzaniaThailandTimor-LesteTogoTongaTrinidad and TobagoTunisiaTurkeyTuvaluUgandaUkraineUnited KingdomUnited StatesUpper middle incomeUruguayVanuatuVenezuela, RBVietnamWest Bank and GazaWorldYemen, Rep.ZambiaZimbabwe Timeline:
This timeline shows a graph from 1978 to 2016 of Latin America & Caribbean (excluding high income). No data until 1977. Number of actual observations by date: 39.
Source name:
World Development Indicators
Source organization:
International Monetary Fund, Balance of Payments Statistics Yearbook and data files.
Categories, topics:
Economy & Growth
Last updated:
apr 23, 2017
Indicators value changes by year
Minimum:
7.81 bln
jan 1, 1978
Maximum:
203.125 bln
jan 1, 2012
At the date of observation
Value
Absolute change
Change from previous value
jan 1, 1978
7.81 bln
+7.81 bln
0.0%
jan 1, 1979
10.279 bln
+2.469 bln
31.62%
jan 1, 1980
19.372 bln
+9.094 bln
88.47%
jan 1, 1981
30.125 bln
+10.753 bln
55.51%
jan 1, 1982
42.192 bln
+12.067 bln
40.06%
jan 1, 1983
50.235 bln
+8.043 bln
19.06%
jan 1, 1984
42.295 bln
-7.939 bln
-15.8%
jan 1, 1985
45.99 bln
+3.695 bln
8.74%
jan 1, 1986
43.313 bln
-2.677 bln
-5.82%
jan 1, 1987
39.084 bln
-4.229 bln
-9.76%
jan 1, 1988
36.865 bln
-2.219 bln
-5.68%
jan 1, 1989
40.125 bln
+3.26 bln
8.84%
jan 1, 1990
45.461 bln
+5.336 bln
13.3%
jan 1, 1991
43.848 bln
-1.613 bln
-3.55%
jan 1, 1992
40.39 bln
-3.458 bln
-7.89%
jan 1, 1993
38.676 bln
-1.715 bln
-4.24%
jan 1, 1994
43.72 bln
+5.044 bln
13.04%
jan 1, 1995
47.467 bln
+3.748 bln
8.57%
jan 1, 1996
56.518 bln
+9.051 bln
19.07%
jan 1, 1997
59.957 bln
+3.439 bln
6.09%
jan 1, 1998
67.948 bln
+7.991 bln
13.33%
jan 1, 1999
73.516 bln
+5.568 bln
8.19%
jan 1, 2000
70.405 bln
-3.111 bln
-4.23%
jan 1, 2001
75.958 bln
+5.553 bln
7.89%
jan 1, 2002
73.662 bln
-2.296 bln
-3.02%
jan 1, 2003
66.345 bln
-7.317 bln
-9.93%
jan 1, 2004
69.678 bln
+3.333 bln
5.02%
jan 1, 2005
78.912 bln
+9.234 bln
13.25%
jan 1, 2006
93.777 bln
+14.865 bln
18.84%
jan 1, 2007
110.716 bln
+16.938 bln
18.06%
jan 1, 2008
129.642 bln
+18.926 bln
17.09%
jan 1, 2009
141.514 bln
+11.872 bln
9.16%
jan 1, 2010
118.096 bln
-23.418 bln
-16.55%
jan 1, 2011
174.26 bln
+56.164 bln
47.56%
jan 1, 2012
203.125 bln
+28.865 bln
16.56%
jan 1, 2013
181.354 bln
-21.771 bln
-10.72%
jan 1, 2014
173.326 bln
-8.028 bln
-4.43%
jan 1, 2015
182.762 bln
+9.436 bln
5.44%
jan 1, 2016
159.88 bln
-22.882 bln
-12.52%
Ranking of countries by current statistics by years


Comments: