29
/
en
AIzaSyAYiBZKx7MnpbEhh9jyipgxe19OcubqV5w
April 1, 2024
71598
Armenia
ARM
true
2
1
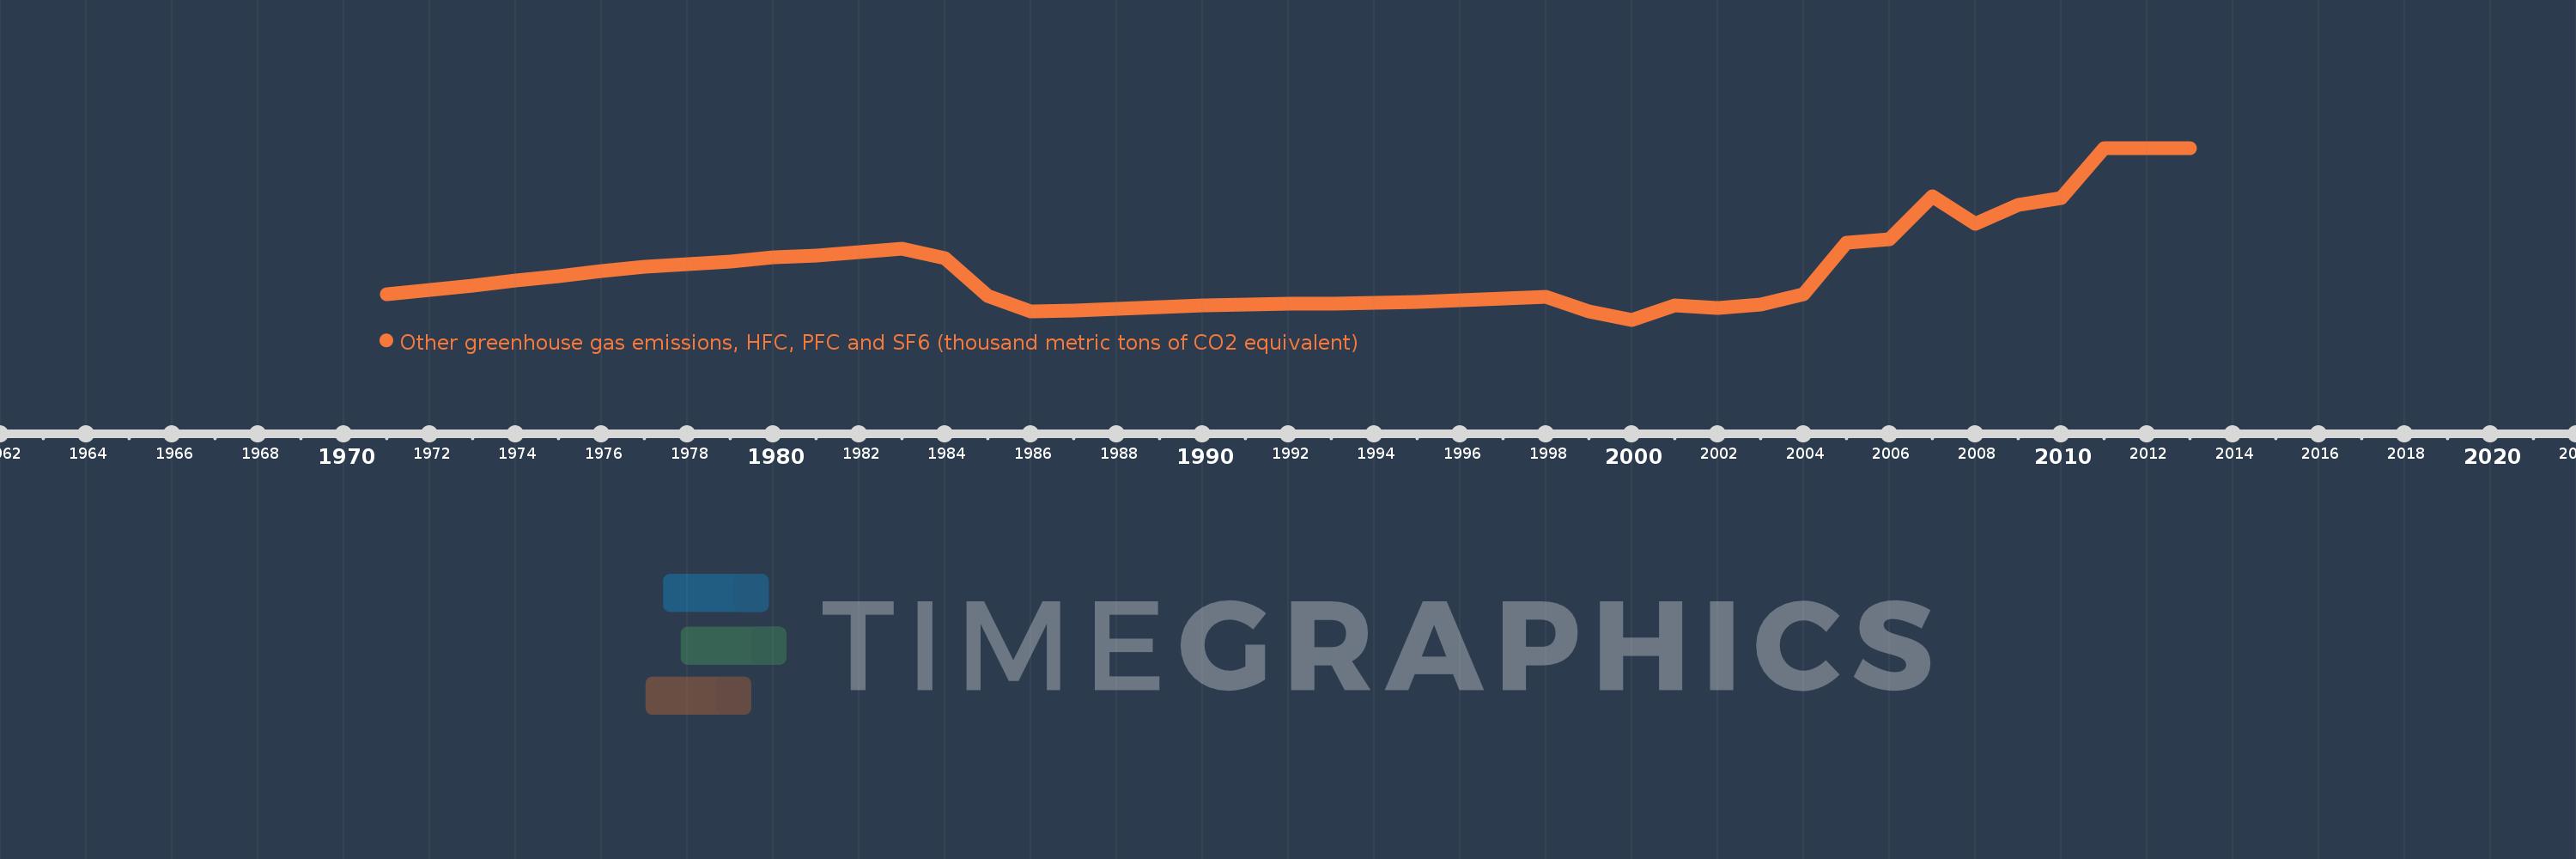
Other greenhouse gas emissions, HFC, PFC and SF6 (thousand metric tons of CO2 equivalent)
2013,2012,2011,2010,2009,2008,2007,2006,2005,2004,2003,2002,2001,2000,1999,1998,1997,1996,1995,1994,1993,1992,1991,1990,1989,1988,1987,1986,1985,1984,1983,1982,1981,1980,1979,1978,1977,1976,1975,1974,1973,1972,1971
This statistics in other country:
AfghanistanAlbaniaAlgeriaAmerican SamoaAngolaAntigua and BarbudaArab WorldArgentinaArmeniaArubaAustraliaAustriaAzerbaijanBahamas, TheBahrainBangladeshBarbadosBelarusBelgiumBelizeBeninBermudaBhutanBoliviaBosnia and HerzegovinaBotswanaBrazilBritish Virgin IslandsBrunei DarussalamBulgariaBurkina FasoBurundiCabo VerdeCambodiaCameroonCanadaCaribbean small statesCayman IslandsCentral African RepublicCentral Europe and the BalticsChadChileChinaColombiaComorosCongo, Dem. Rep.Congo, Rep.Costa RicaCote d'IvoireCroatiaCubaCyprusCzech RepublicDenmarkDjiboutiDominicaDominican RepublicEarly-demographic dividendEast Asia & PacificEast Asia & Pacific (excluding high income)East Asia & Pacific (IDA & IBRD countries)EcuadorEgypt, Arab Rep.El SalvadorEquatorial GuineaEritreaEstoniaEthiopiaEuro areaEurope & Central AsiaEurope & Central Asia (excluding high income)Europe & Central Asia (IDA & IBRD countries)European UnionFaroe IslandsFijiFinlandFragile and conflict affected situationsFranceFrench PolynesiaGabonGambia, TheGeorgiaGermanyGhanaGibraltarGreeceGreenlandGrenadaGuamGuatemalaGuineaGuinea-BissauGuyanaHaitiHeavily indebted poor countries (HIPC)High incomeHondurasHong Kong SAR, ChinaHungaryIBRD onlyIcelandIDA & IBRD totalIDA blendIDA onlyIDA totalIndiaIndonesiaIran, Islamic Rep.IraqIrelandIsraelItalyJamaicaJapanJordanKazakhstanKenyaKiribatiKorea, Dem. People’s Rep.Korea, Rep.KuwaitKyrgyz RepublicLao PDRLate-demographic dividendLatin America & Caribbean Latin America & Caribbean (excluding high income)Latin America & the Caribbean (IDA & IBRD countries)LatviaLeast developed countries: UN classificationLebanonLesothoLiberiaLibyaLithuaniaLow & middle incomeLow incomeLower middle incomeLuxembourgMacao SAR, ChinaMacedonia, FYRMadagascarMalawiMalaysiaMaldivesMaliMaltaMauritaniaMauritiusMexicoMiddle East & North AfricaMiddle East & North Africa (excluding high income)Middle East & North Africa (IDA & IBRD countries)Middle incomeMoldovaMongoliaMoroccoMozambiqueMyanmarNamibiaNauruNepalNetherlandsNew CaledoniaNew ZealandNicaraguaNigerNigeriaNorth AmericaNorwayOECD membersOmanOther small statesPacific island small statesPakistanPanamaPapua New GuineaParaguayPeruPhilippinesPolandPortugalPost-demographic dividendPre-demographic dividendPuerto RicoQatarRomaniaRussian FederationRwandaSamoaSao Tome and PrincipeSaudi ArabiaSenegalSeychellesSierra LeoneSingaporeSlovak RepublicSloveniaSmall statesSolomon IslandsSomaliaSouth AfricaSouth AsiaSouth Asia (IDA & IBRD)SpainSri LankaSt. Kitts and NevisSt. LuciaSt. Vincent and the GrenadinesSub-Saharan Africa Sub-Saharan Africa (excluding high income)Sub-Saharan Africa (IDA & IBRD countries)SudanSurinameSwazilandSwedenSwitzerlandSyrian Arab RepublicTajikistanTanzaniaThailandTimor-LesteTogoTongaTrinidad and TobagoTunisiaTurkeyTurkmenistanTurks and Caicos IslandsTuvaluUgandaUkraineUnited Arab EmiratesUnited KingdomUnited StatesUpper middle incomeUruguayUzbekistanVanuatuVenezuela, RBVietnamVirgin Islands (U.S.)WorldYemen, Rep.ZambiaZimbabwe Timeline:
This timeline shows a graph from 1971 to 2013 of Armenia. No data until 1970. Number of actual observations by date: 43.
Source name:
World Development Indicators
Source organization:
World Bank staff estimates from original source: European Commission, Joint Research Centre (JRC)/Netherlands Environmental Assessment Agency (PBL). Emission Database for Global Atmospheric Research (EDGAR): http://edgar.jrc.ec.europa.eu/.
Categories, topics:
Climate Change, Environment
Last updated:
apr 23, 2017
Indicators value changes by year
Minimum:
56.966
jan 1, 2000
Maximum:
709.543
jan 1, 2011
At the date of observation
Value
Absolute change
Change from previous value
jan 1, 1971
153.0
+153.0
0.0%
jan 1, 1972
169.8
+16.8
10.98%
jan 1, 1973
185.6
+15.8
9.31%
jan 1, 1974
205.4
+19.8
10.67%
jan 1, 1975
221.2
+15.8
7.69%
jan 1, 1976
241.0
+19.8
8.95%
jan 1, 1977
256.8
+15.8
6.56%
jan 1, 1978
267.6
+10.8
4.21%
jan 1, 1979
278.4
+10.8
4.04%
jan 1, 1980
295.2
+16.8
6.03%
jan 1, 1981
302.0
+6.8
2.3%
jan 1, 1982
312.8
+10.8
3.58%
jan 1, 1983
326.6
+13.8
4.41%
jan 1, 1984
291.4
-35.2
-10.78%
jan 1, 1985
145.8
-145.6
-49.97%
jan 1, 1986
87.0
-58.8
-40.33%
jan 1, 1987
92.8
+5.8
6.67%
jan 1, 1988
98.6
+5.8
6.25%
jan 1, 1989
104.4
+5.8
5.88%
jan 1, 1990
110.2
+5.8
5.56%
jan 1, 1991
116.028
+5.828
5.29%
jan 1, 1992
117.846
+1.818
1.57%
jan 1, 1993
119.521
+1.675
1.42%
jan 1, 1994
121.913
+2.392
2.0%
jan 1, 1995
125.294
+3.381
2.77%
jan 1, 1996
130.846
+5.552
4.43%
jan 1, 1997
137.367
+6.521
4.98%
jan 1, 1998
142.878
+5.511
4.01%
jan 1, 1999
89.908
-52.97
-37.07%
jan 1, 2000
56.966
-32.942
-36.64%
jan 1, 2001
111.654
+54.689
96.0%
jan 1, 2002
100.04
-11.615
-10.4%
jan 1, 2003
113.981
+13.941
13.94%
jan 1, 2004
153.841
+39.86
34.97%
jan 1, 2005
350.777
+196.936
128.01%
jan 1, 2006
363.926
+13.149
3.75%
jan 1, 2007
527.144
+163.218
44.85%
jan 1, 2008
422.209
-104.935
-19.91%
jan 1, 2009
491.804
+69.596
16.48%
jan 1, 2010
519.0
+27.196
5.53%
jan 1, 2011
709.543
+190.543
36.71%
jan 1, 2012
709.543
0.0
0.0%
jan 1, 2013
709.543
0.0
0.0%
Ranking of countries by current statistics by years


Comments: