29
/
en
AIzaSyAYiBZKx7MnpbEhh9jyipgxe19OcubqV5w
April 1, 2024
204489
Myanmar
MMR
true
2
1
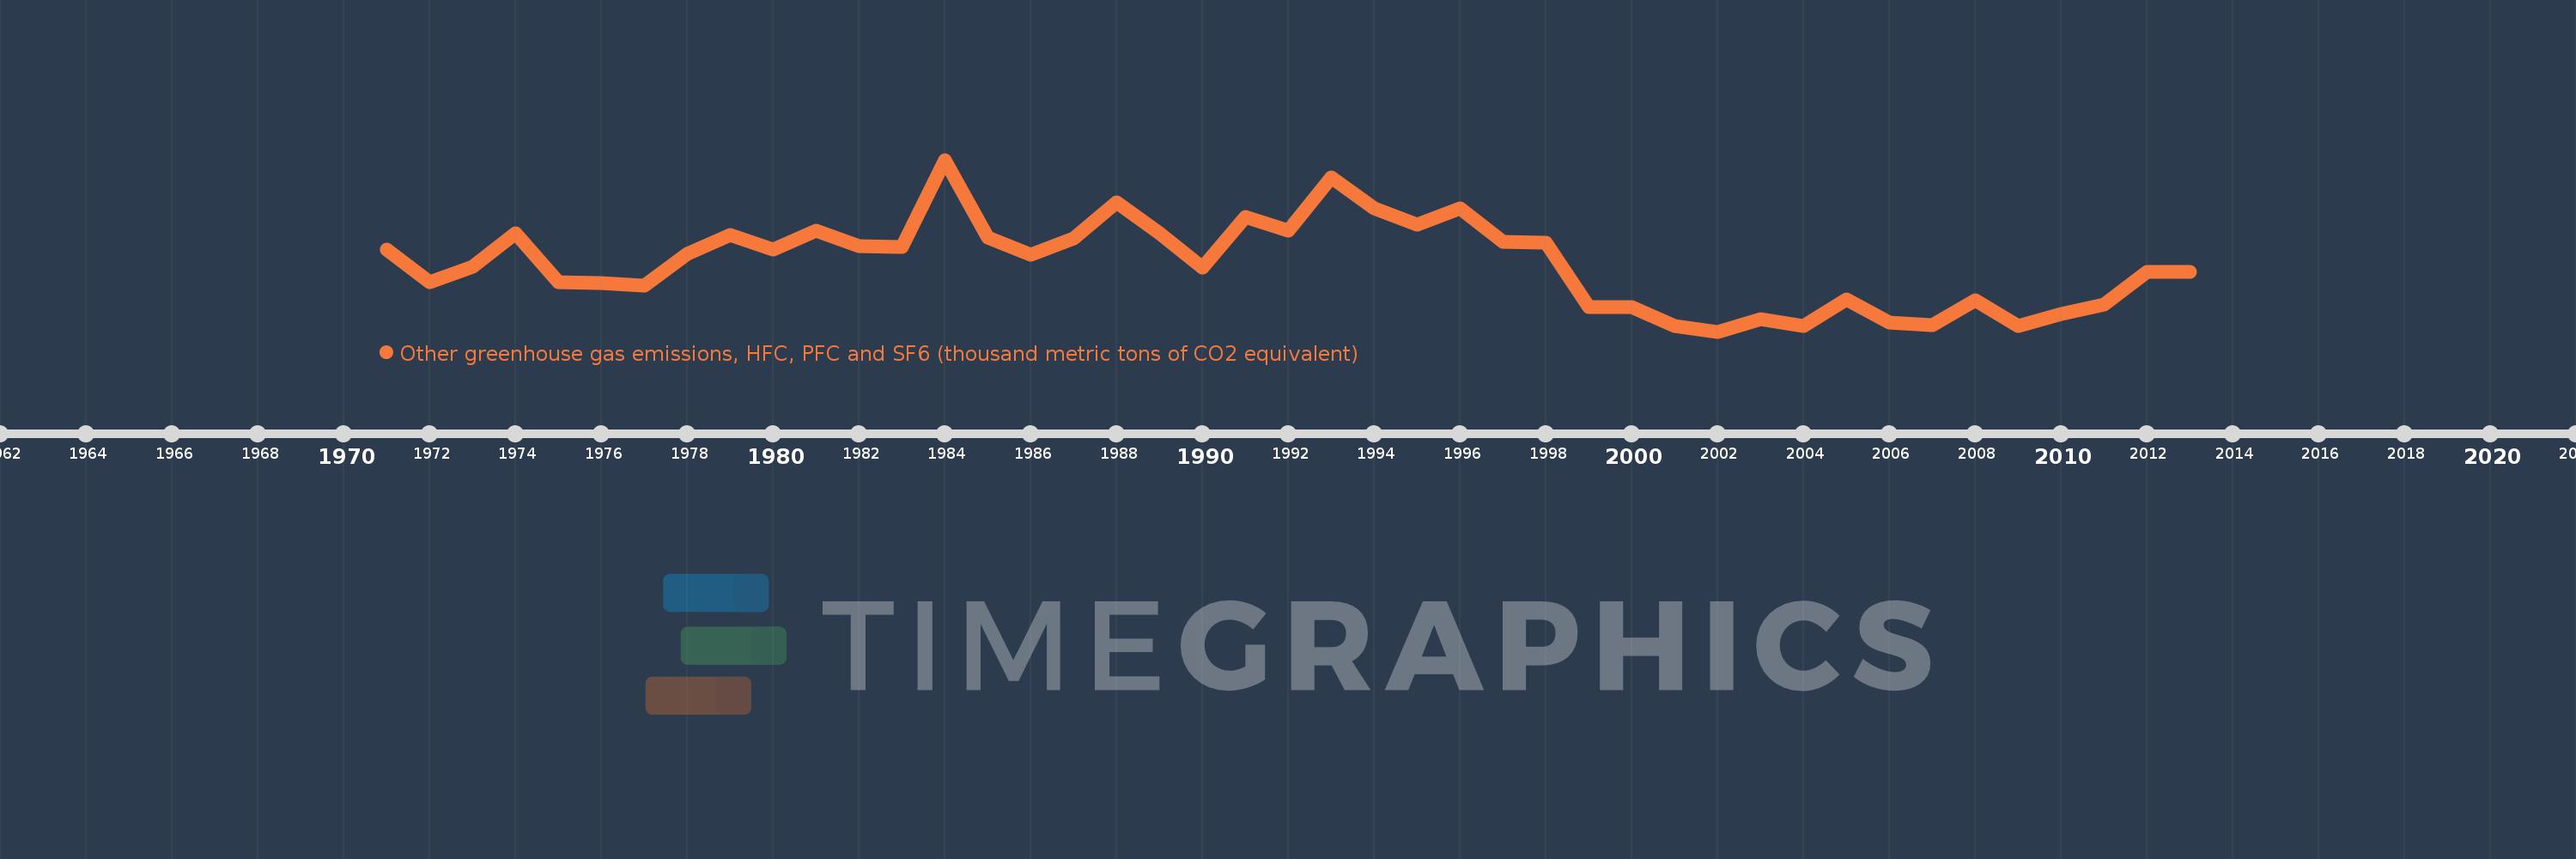
Other greenhouse gas emissions, HFC, PFC and SF6 (thousand metric tons of CO2 equivalent)
2013,2012,2011,2010,2009,2008,2007,2006,2005,2004,2003,2002,2001,2000,1999,1998,1997,1996,1995,1994,1993,1992,1991,1990,1989,1988,1987,1986,1985,1984,1983,1982,1981,1980,1979,1978,1977,1976,1975,1974,1973,1972,1971
This statistics in other country:
AfghanistanAlbaniaAlgeriaAmerican SamoaAngolaAntigua and BarbudaArab WorldArgentinaArmeniaArubaAustraliaAustriaAzerbaijanBahamas, TheBahrainBangladeshBarbadosBelarusBelgiumBelizeBeninBermudaBhutanBoliviaBosnia and HerzegovinaBotswanaBrazilBritish Virgin IslandsBrunei DarussalamBulgariaBurkina FasoBurundiCabo VerdeCambodiaCameroonCanadaCaribbean small statesCayman IslandsCentral African RepublicCentral Europe and the BalticsChadChileChinaColombiaComorosCongo, Dem. Rep.Congo, Rep.Costa RicaCote d'IvoireCroatiaCubaCyprusCzech RepublicDenmarkDjiboutiDominicaDominican RepublicEarly-demographic dividendEast Asia & PacificEast Asia & Pacific (excluding high income)East Asia & Pacific (IDA & IBRD countries)EcuadorEgypt, Arab Rep.El SalvadorEquatorial GuineaEritreaEstoniaEthiopiaEuro areaEurope & Central AsiaEurope & Central Asia (excluding high income)Europe & Central Asia (IDA & IBRD countries)European UnionFaroe IslandsFijiFinlandFragile and conflict affected situationsFranceFrench PolynesiaGabonGambia, TheGeorgiaGermanyGhanaGibraltarGreeceGreenlandGrenadaGuamGuatemalaGuineaGuinea-BissauGuyanaHaitiHeavily indebted poor countries (HIPC)High incomeHondurasHong Kong SAR, ChinaHungaryIBRD onlyIcelandIDA & IBRD totalIDA blendIDA onlyIDA totalIndiaIndonesiaIran, Islamic Rep.IraqIrelandIsraelItalyJamaicaJapanJordanKazakhstanKenyaKiribatiKorea, Dem. People’s Rep.Korea, Rep.KuwaitKyrgyz RepublicLao PDRLate-demographic dividendLatin America & Caribbean Latin America & Caribbean (excluding high income)Latin America & the Caribbean (IDA & IBRD countries)LatviaLeast developed countries: UN classificationLebanonLesothoLiberiaLibyaLithuaniaLow & middle incomeLow incomeLower middle incomeLuxembourgMacao SAR, ChinaMacedonia, FYRMadagascarMalawiMalaysiaMaldivesMaliMaltaMauritaniaMauritiusMexicoMiddle East & North AfricaMiddle East & North Africa (excluding high income)Middle East & North Africa (IDA & IBRD countries)Middle incomeMoldovaMongoliaMoroccoMozambiqueMyanmarNamibiaNauruNepalNetherlandsNew CaledoniaNew ZealandNicaraguaNigerNigeriaNorth AmericaNorwayOECD membersOmanOther small statesPacific island small statesPakistanPanamaPapua New GuineaParaguayPeruPhilippinesPolandPortugalPost-demographic dividendPre-demographic dividendPuerto RicoQatarRomaniaRussian FederationRwandaSamoaSao Tome and PrincipeSaudi ArabiaSenegalSeychellesSierra LeoneSingaporeSlovak RepublicSloveniaSmall statesSolomon IslandsSomaliaSouth AfricaSouth AsiaSouth Asia (IDA & IBRD)SpainSri LankaSt. Kitts and NevisSt. LuciaSt. Vincent and the GrenadinesSub-Saharan Africa Sub-Saharan Africa (excluding high income)Sub-Saharan Africa (IDA & IBRD countries)SudanSurinameSwazilandSwedenSwitzerlandSyrian Arab RepublicTajikistanTanzaniaThailandTimor-LesteTogoTongaTrinidad and TobagoTunisiaTurkeyTurkmenistanTurks and Caicos IslandsTuvaluUgandaUkraineUnited Arab EmiratesUnited KingdomUnited StatesUpper middle incomeUruguayUzbekistanVanuatuVenezuela, RBVietnamVirgin Islands (U.S.)WorldYemen, Rep.ZambiaZimbabwe Timeline:
This timeline shows a graph from 1971 to 2013 of Myanmar. No data until 1970. Number of actual observations by date: 43.
Source name:
World Development Indicators
Source organization:
World Bank staff estimates from original source: European Commission, Joint Research Centre (JRC)/Netherlands Environmental Assessment Agency (PBL). Emission Database for Global Atmospheric Research (EDGAR): http://edgar.jrc.ec.europa.eu/.
Categories, topics:
Climate Change, Environment
Last updated:
apr 23, 2017
Indicators value changes by year
Minimum:
42.525K
jan 1, 2002
Maximum:
1.093 mln
jan 1, 1984
At the date of observation
Value
Absolute change
Change from previous value
jan 1, 1971
543.252K
+543.252K
0.0%
jan 1, 1972
342.042K
-201.21K
-37.04%
jan 1, 1973
437.68K
+95.638K
27.96%
jan 1, 1974
643.776K
+206.096K
47.09%
jan 1, 1975
345.917K
-297.859K
-46.27%
jan 1, 1976
338.002K
-7.915K
-2.29%
jan 1, 1977
324.569K
-13.433K
-3.97%
jan 1, 1978
518.239K
+193.67K
59.67%
jan 1, 1979
635.864K
+117.625K
22.7%
jan 1, 1980
546.441K
-89.423K
-14.06%
jan 1, 1981
657.219K
+110.778K
20.27%
jan 1, 1982
567.799K
-89.42K
-13.61%
jan 1, 1983
561.327K
-6.472K
-1.14%
jan 1, 1984
1.093 mln
+531.838K
94.75%
jan 1, 1985
617.156K
-476.009K
-43.54%
jan 1, 1986
513.98K
-103.176K
-16.72%
jan 1, 1987
610.826K
+96.846K
18.84%
jan 1, 1988
831.944K
+221.118K
36.2%
jan 1, 1989
645.758K
-186.186K
-22.38%
jan 1, 1990
431.946K
-213.812K
-33.11%
jan 1, 1991
742.806K
+310.86K
71.97%
jan 1, 1992
659.969K
-82.837K
-11.15%
jan 1, 1993
984.444K
+324.475K
49.17%
jan 1, 1994
798.054K
-186.39K
-18.93%
jan 1, 1995
694.501K
-103.553K
-12.98%
jan 1, 1996
798.054K
+103.553K
14.91%
jan 1, 1997
590.947K
-207.107K
-25.95%
jan 1, 1998
584.043K
-6.904K
-1.17%
jan 1, 1999
189.756K
-394.287K
-67.51%
jan 1, 2000
189.731K
-25.0
-0.01%
jan 1, 2001
78.176K
-111.555K
-58.8%
jan 1, 2002
42.525K
-35.651K
-45.6%
jan 1, 2003
118.699K
+76.174K
179.13%
jan 1, 2004
74.254K
-44.444K
-37.44%
jan 1, 2005
238.181K
+163.927K
220.76%
jan 1, 2006
99.684K
-138.497K
-58.15%
jan 1, 2007
84.17K
-15.514K
-15.56%
jan 1, 2008
232.544K
+148.374K
176.28%
jan 1, 2009
75.751K
-156.792K
-67.42%
jan 1, 2010
151.865K
+76.114K
100.48%
jan 1, 2011
206.274K
+54.409K
35.83%
jan 1, 2012
406.274K
+200.0K
96.96%
jan 1, 2013
406.274K
0.0
0.0%
Ranking of countries by current statistics by years


Comments: