29
/
en
AIzaSyAYiBZKx7MnpbEhh9jyipgxe19OcubqV5w
April 1, 2024
275098
United Arab Emirates
ARE
true
2
1
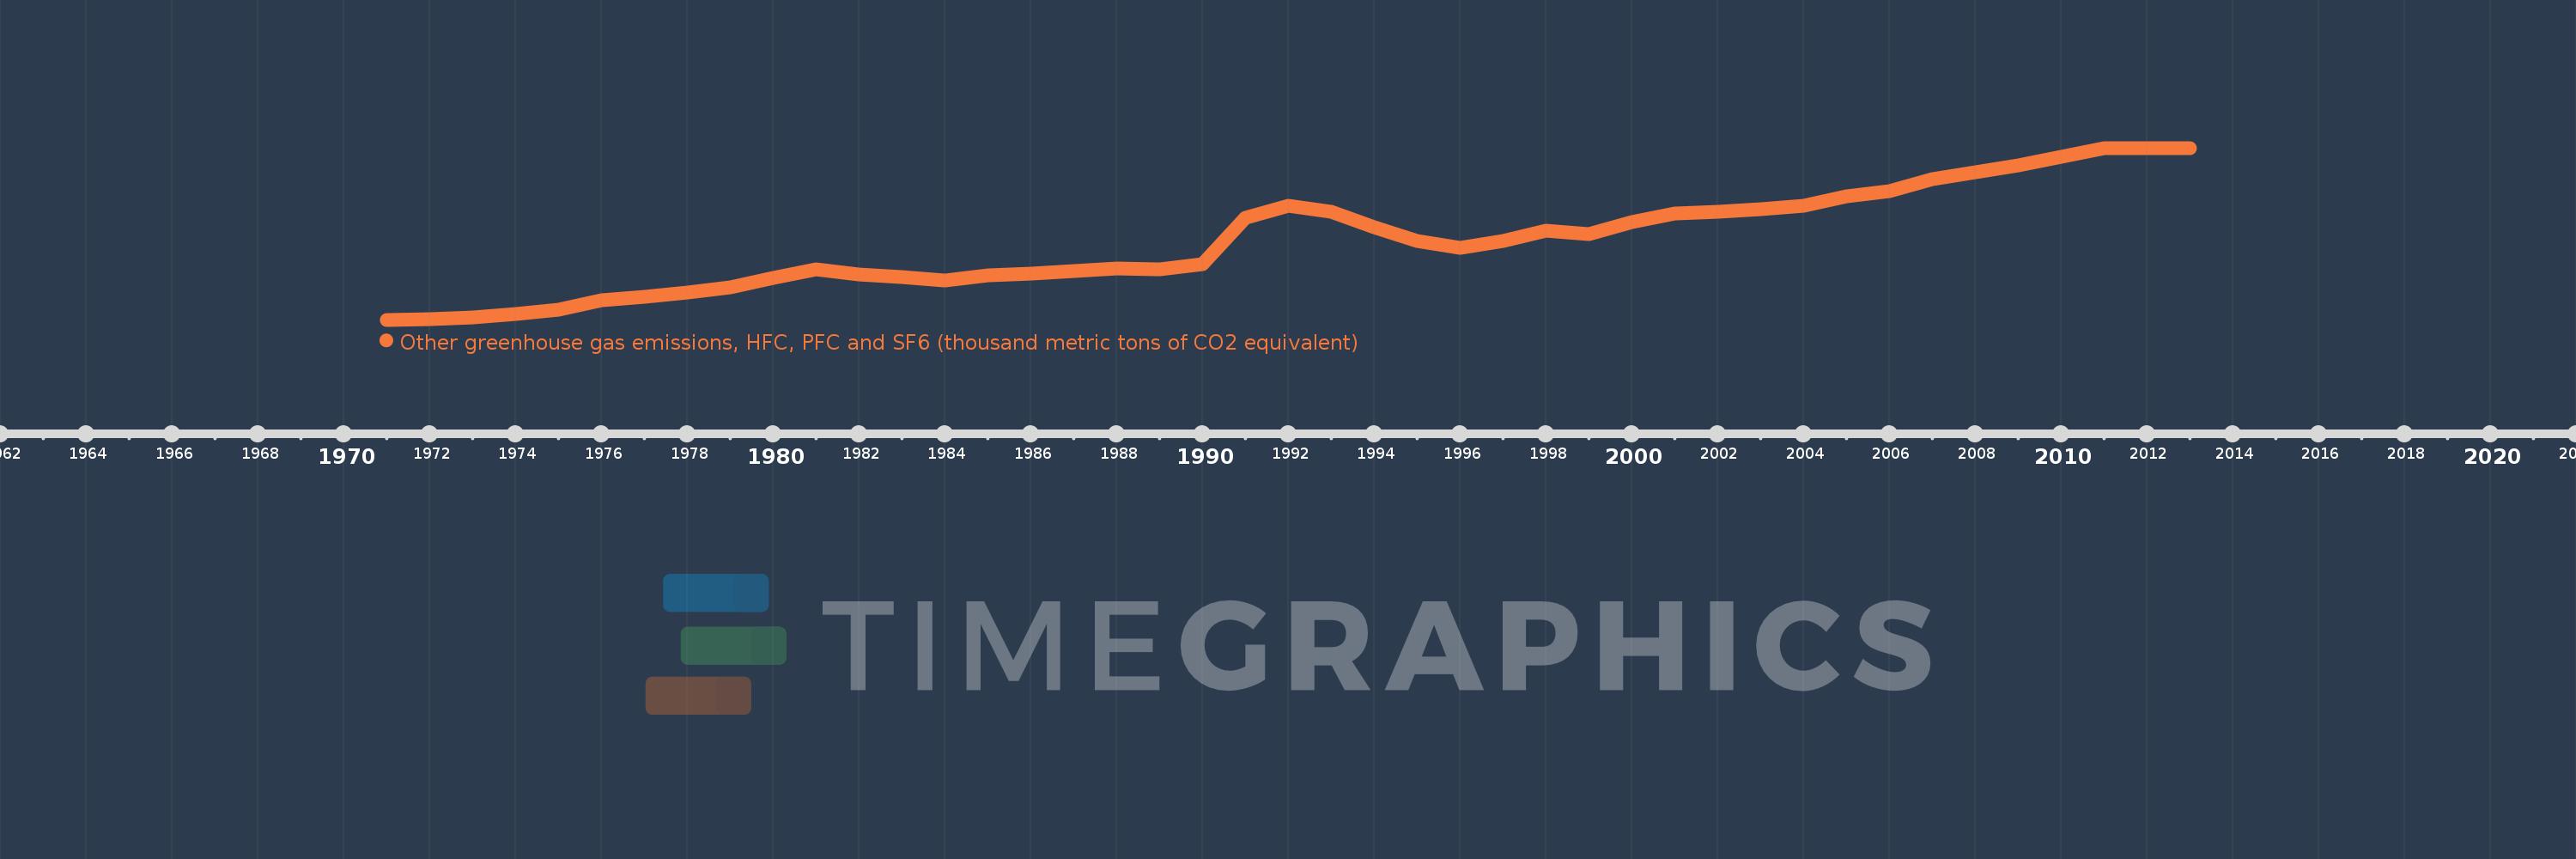
Other greenhouse gas emissions, HFC, PFC and SF6 (thousand metric tons of CO2 equivalent)
2013,2012,2011,2010,2009,2008,2007,2006,2005,2004,2003,2002,2001,2000,1999,1998,1997,1996,1995,1994,1993,1992,1991,1990,1989,1988,1987,1986,1985,1984,1983,1982,1981,1980,1979,1978,1977,1976,1975,1974,1973,1972,1971
This statistics in other country:
AfghanistanAlbaniaAlgeriaAmerican SamoaAngolaAntigua and BarbudaArab WorldArgentinaArmeniaArubaAustraliaAustriaAzerbaijanBahamas, TheBahrainBangladeshBarbadosBelarusBelgiumBelizeBeninBermudaBhutanBoliviaBosnia and HerzegovinaBotswanaBrazilBritish Virgin IslandsBrunei DarussalamBulgariaBurkina FasoBurundiCabo VerdeCambodiaCameroonCanadaCaribbean small statesCayman IslandsCentral African RepublicCentral Europe and the BalticsChadChileChinaColombiaComorosCongo, Dem. Rep.Congo, Rep.Costa RicaCote d'IvoireCroatiaCubaCyprusCzech RepublicDenmarkDjiboutiDominicaDominican RepublicEarly-demographic dividendEast Asia & PacificEast Asia & Pacific (excluding high income)East Asia & Pacific (IDA & IBRD countries)EcuadorEgypt, Arab Rep.El SalvadorEquatorial GuineaEritreaEstoniaEthiopiaEuro areaEurope & Central AsiaEurope & Central Asia (excluding high income)Europe & Central Asia (IDA & IBRD countries)European UnionFaroe IslandsFijiFinlandFragile and conflict affected situationsFranceFrench PolynesiaGabonGambia, TheGeorgiaGermanyGhanaGibraltarGreeceGreenlandGrenadaGuamGuatemalaGuineaGuinea-BissauGuyanaHaitiHeavily indebted poor countries (HIPC)High incomeHondurasHong Kong SAR, ChinaHungaryIBRD onlyIcelandIDA & IBRD totalIDA blendIDA onlyIDA totalIndiaIndonesiaIran, Islamic Rep.IraqIrelandIsraelItalyJamaicaJapanJordanKazakhstanKenyaKiribatiKorea, Dem. People’s Rep.Korea, Rep.KuwaitKyrgyz RepublicLao PDRLate-demographic dividendLatin America & Caribbean Latin America & Caribbean (excluding high income)Latin America & the Caribbean (IDA & IBRD countries)LatviaLeast developed countries: UN classificationLebanonLesothoLiberiaLibyaLithuaniaLow & middle incomeLow incomeLower middle incomeLuxembourgMacao SAR, ChinaMacedonia, FYRMadagascarMalawiMalaysiaMaldivesMaliMaltaMauritaniaMauritiusMexicoMiddle East & North AfricaMiddle East & North Africa (excluding high income)Middle East & North Africa (IDA & IBRD countries)Middle incomeMoldovaMongoliaMoroccoMozambiqueMyanmarNamibiaNauruNepalNetherlandsNew CaledoniaNew ZealandNicaraguaNigerNigeriaNorth AmericaNorwayOECD membersOmanOther small statesPacific island small statesPakistanPanamaPapua New GuineaParaguayPeruPhilippinesPolandPortugalPost-demographic dividendPre-demographic dividendPuerto RicoQatarRomaniaRussian FederationRwandaSamoaSao Tome and PrincipeSaudi ArabiaSenegalSeychellesSierra LeoneSingaporeSlovak RepublicSloveniaSmall statesSolomon IslandsSomaliaSouth AfricaSouth AsiaSouth Asia (IDA & IBRD)SpainSri LankaSt. Kitts and NevisSt. LuciaSt. Vincent and the GrenadinesSub-Saharan Africa Sub-Saharan Africa (excluding high income)Sub-Saharan Africa (IDA & IBRD countries)SudanSurinameSwazilandSwedenSwitzerlandSyrian Arab RepublicTajikistanTanzaniaThailandTimor-LesteTogoTongaTrinidad and TobagoTunisiaTurkeyTurkmenistanTurks and Caicos IslandsTuvaluUgandaUkraineUnited Arab EmiratesUnited KingdomUnited StatesUpper middle incomeUruguayUzbekistanVanuatuVenezuela, RBVietnamVirgin Islands (U.S.)WorldYemen, Rep.ZambiaZimbabwe Timeline:
This timeline shows a graph from 1971 to 2013 of United Arab Emirates. No data until 1970. Number of actual observations by date: 43.
Source name:
World Development Indicators
Source organization:
World Bank staff estimates from original source: European Commission, Joint Research Centre (JRC)/Netherlands Environmental Assessment Agency (PBL). Emission Database for Global Atmospheric Research (EDGAR): http://edgar.jrc.ec.europa.eu/.
Categories, topics:
Climate Change, Environment
Last updated:
apr 23, 2017
Indicators value changes by year
Maximum:
1.425K
jan 1, 2011
At the date of observation
Value
Absolute change
Change from previous value
jan 1, 1972
6.7
+6.7
1309.64 trl%
jan 1, 1973
20.8
+14.1
210.45%
jan 1, 1974
49.25
+28.45
136.78%
jan 1, 1975
83.5
+34.25
69.54%
jan 1, 1976
160.75
+77.25
92.51%
jan 1, 1977
187.9
+27.15
16.89%
jan 1, 1978
227.05
+39.15
20.84%
jan 1, 1979
270.2
+43.15
19.0%
jan 1, 1980
345.35
+75.15
27.81%
jan 1, 1981
421.5
+76.15
22.05%
jan 1, 1982
373.65
-47.85
-11.35%
jan 1, 1983
352.8
-20.85
-5.58%
jan 1, 1984
327.95
-24.85
-7.04%
jan 1, 1985
367.1
+39.15
11.94%
jan 1, 1986
385.25
+18.15
4.94%
jan 1, 1987
403.4
+18.15
4.71%
jan 1, 1988
422.55
+19.15
4.75%
jan 1, 1989
416.7
-5.85
-1.38%
jan 1, 1990
459.85
+43.15
10.36%
jan 1, 1991
846.0
+386.15
83.97%
jan 1, 1992
945.983
+99.983
11.82%
jan 1, 1993
892.967
-53.017
-5.6%
jan 1, 1994
769.95
-123.017
-13.78%
jan 1, 1995
654.933
-115.017
-14.94%
jan 1, 1996
599.917
-55.017
-8.4%
jan 1, 1997
653.9
+53.983
9.0%
jan 1, 1998
737.883
+83.983
12.84%
jan 1, 1999
710.0
-27.883
-3.78%
jan 1, 2000
811.0
+101.0
14.23%
jan 1, 2001
878.0
+67.0
8.26%
jan 1, 2002
898.0
+20.0
2.28%
jan 1, 2003
915.0
+17.0
1.89%
jan 1, 2004
947.0
+32.0
3.5%
jan 1, 2005
1.024K
+77.0
8.13%
jan 1, 2006
1.066K
+42.0
4.1%
jan 1, 2007
1.168K
+102.0
9.57%
jan 1, 2008
1.226K
+58.0
4.97%
jan 1, 2009
1.281K
+55.0
4.49%
jan 1, 2010
1.352K
+71.0
5.54%
jan 1, 2011
1.425K
+73.0
5.4%
jan 1, 2012
1.425K
0.0
0.0%
jan 1, 2013
1.425K
0.0
0.0%
Ranking of countries by current statistics by years


Comments: