29
/
en
AIzaSyAYiBZKx7MnpbEhh9jyipgxe19OcubqV5w
April 1, 2024
122584
Dominican Republic
DOM
true
2
1
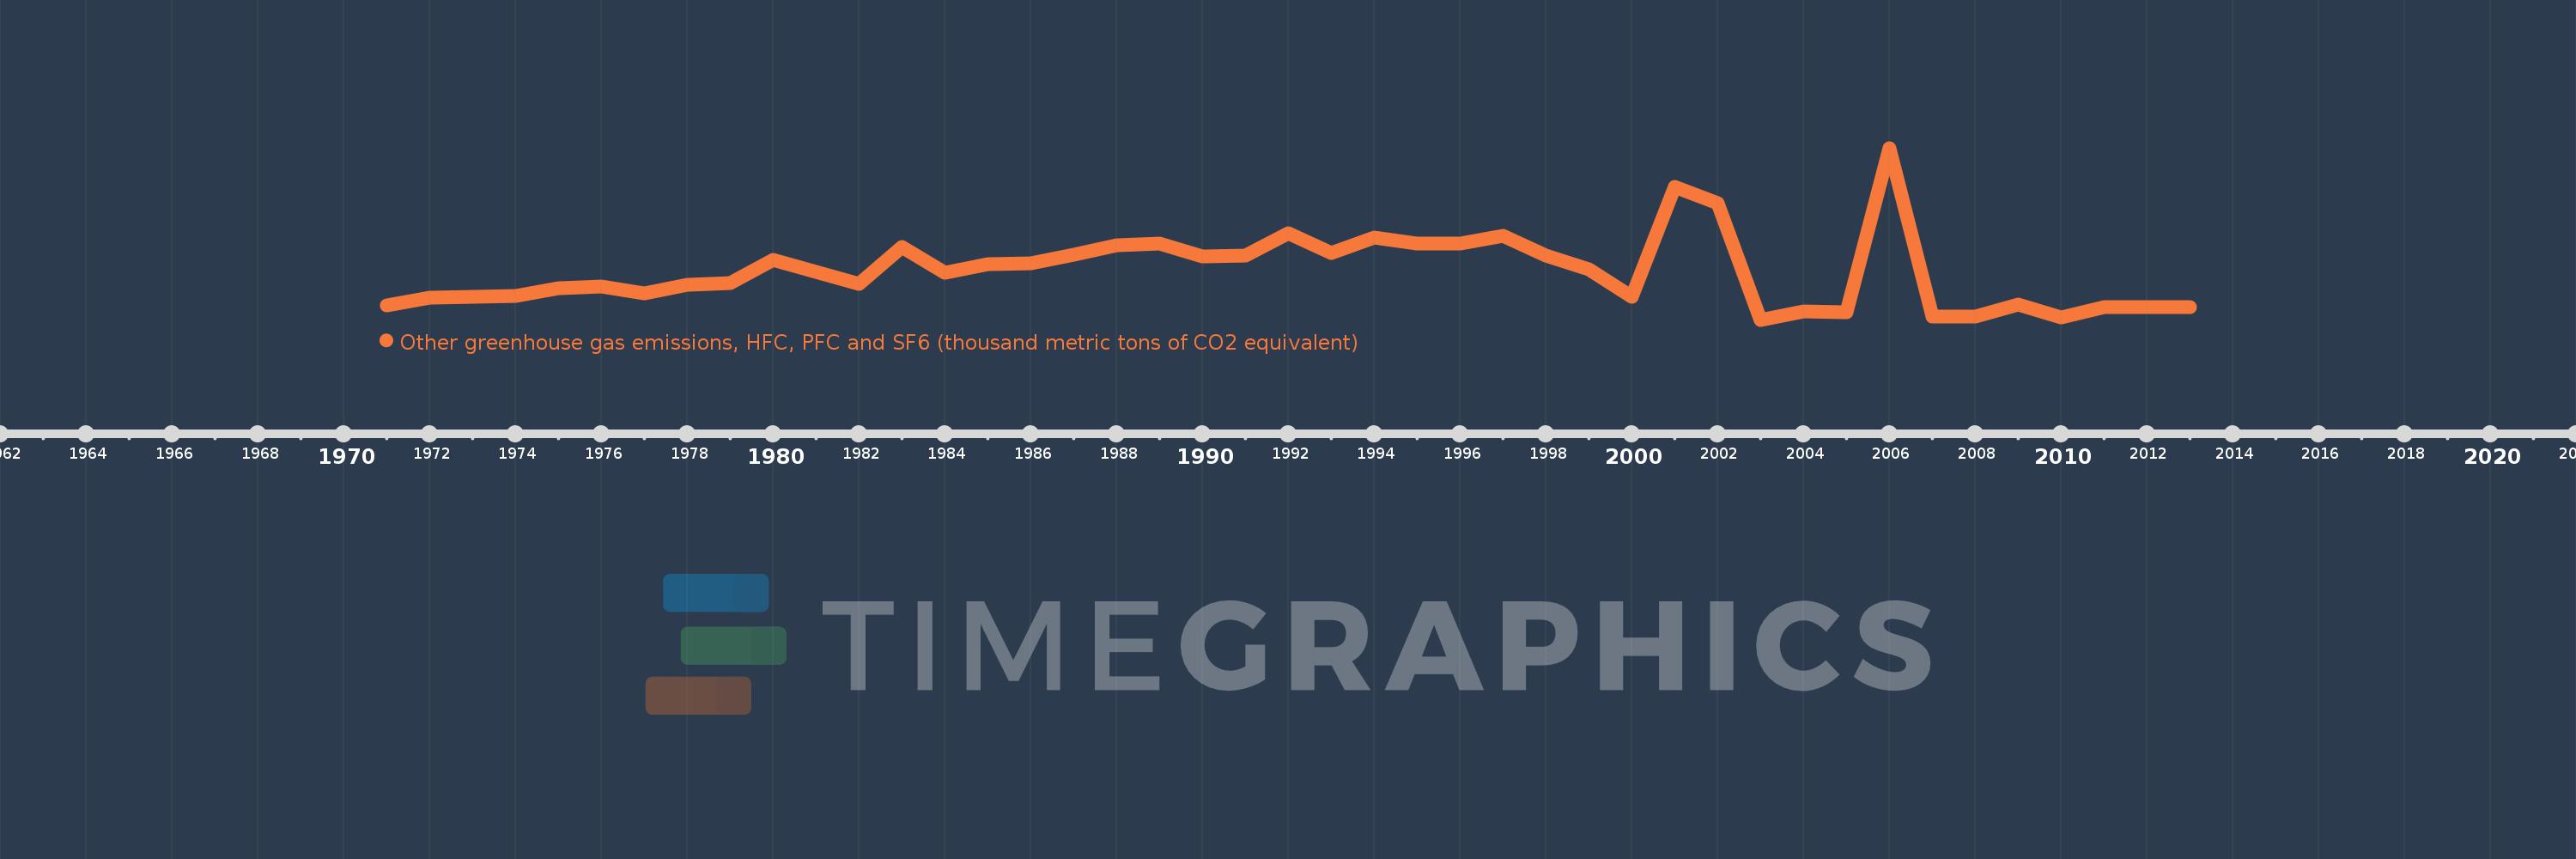
Other greenhouse gas emissions, HFC, PFC and SF6 (thousand metric tons of CO2 equivalent)
2013,2012,2011,2010,2009,2008,2007,2006,2005,2004,2003,2002,2001,2000,1999,1998,1997,1996,1995,1994,1993,1992,1991,1990,1989,1988,1987,1986,1985,1984,1983,1982,1981,1980,1979,1978,1977,1976,1975,1974,1973,1972,1971
This statistics in other country:
AfghanistanAlbaniaAlgeriaAmerican SamoaAngolaAntigua and BarbudaArab WorldArgentinaArmeniaArubaAustraliaAustriaAzerbaijanBahamas, TheBahrainBangladeshBarbadosBelarusBelgiumBelizeBeninBermudaBhutanBoliviaBosnia and HerzegovinaBotswanaBrazilBritish Virgin IslandsBrunei DarussalamBulgariaBurkina FasoBurundiCabo VerdeCambodiaCameroonCanadaCaribbean small statesCayman IslandsCentral African RepublicCentral Europe and the BalticsChadChileChinaColombiaComorosCongo, Dem. Rep.Congo, Rep.Costa RicaCote d'IvoireCroatiaCubaCyprusCzech RepublicDenmarkDjiboutiDominicaDominican RepublicEarly-demographic dividendEast Asia & PacificEast Asia & Pacific (excluding high income)East Asia & Pacific (IDA & IBRD countries)EcuadorEgypt, Arab Rep.El SalvadorEquatorial GuineaEritreaEstoniaEthiopiaEuro areaEurope & Central AsiaEurope & Central Asia (excluding high income)Europe & Central Asia (IDA & IBRD countries)European UnionFaroe IslandsFijiFinlandFragile and conflict affected situationsFranceFrench PolynesiaGabonGambia, TheGeorgiaGermanyGhanaGibraltarGreeceGreenlandGrenadaGuamGuatemalaGuineaGuinea-BissauGuyanaHaitiHeavily indebted poor countries (HIPC)High incomeHondurasHong Kong SAR, ChinaHungaryIBRD onlyIcelandIDA & IBRD totalIDA blendIDA onlyIDA totalIndiaIndonesiaIran, Islamic Rep.IraqIrelandIsraelItalyJamaicaJapanJordanKazakhstanKenyaKiribatiKorea, Dem. People’s Rep.Korea, Rep.KuwaitKyrgyz RepublicLao PDRLate-demographic dividendLatin America & Caribbean Latin America & Caribbean (excluding high income)Latin America & the Caribbean (IDA & IBRD countries)LatviaLeast developed countries: UN classificationLebanonLesothoLiberiaLibyaLithuaniaLow & middle incomeLow incomeLower middle incomeLuxembourgMacao SAR, ChinaMacedonia, FYRMadagascarMalawiMalaysiaMaldivesMaliMaltaMauritaniaMauritiusMexicoMiddle East & North AfricaMiddle East & North Africa (excluding high income)Middle East & North Africa (IDA & IBRD countries)Middle incomeMoldovaMongoliaMoroccoMozambiqueMyanmarNamibiaNauruNepalNetherlandsNew CaledoniaNew ZealandNicaraguaNigerNigeriaNorth AmericaNorwayOECD membersOmanOther small statesPacific island small statesPakistanPanamaPapua New GuineaParaguayPeruPhilippinesPolandPortugalPost-demographic dividendPre-demographic dividendPuerto RicoQatarRomaniaRussian FederationRwandaSamoaSao Tome and PrincipeSaudi ArabiaSenegalSeychellesSierra LeoneSingaporeSlovak RepublicSloveniaSmall statesSolomon IslandsSomaliaSouth AfricaSouth AsiaSouth Asia (IDA & IBRD)SpainSri LankaSt. Kitts and NevisSt. LuciaSt. Vincent and the GrenadinesSub-Saharan Africa Sub-Saharan Africa (excluding high income)Sub-Saharan Africa (IDA & IBRD countries)SudanSurinameSwazilandSwedenSwitzerlandSyrian Arab RepublicTajikistanTanzaniaThailandTimor-LesteTogoTongaTrinidad and TobagoTunisiaTurkeyTurkmenistanTurks and Caicos IslandsTuvaluUgandaUkraineUnited Arab EmiratesUnited KingdomUnited StatesUpper middle incomeUruguayUzbekistanVanuatuVenezuela, RBVietnamVirgin Islands (U.S.)WorldYemen, Rep.ZambiaZimbabwe Timeline:
This timeline shows a graph from 1971 to 2013 of Dominican Republic. No data until 1970. Number of actual observations by date: 43.
Source name:
World Development Indicators
Source organization:
World Bank staff estimates from original source: European Commission, Joint Research Centre (JRC)/Netherlands Environmental Assessment Agency (PBL). Emission Database for Global Atmospheric Research (EDGAR): http://edgar.jrc.ec.europa.eu/.
Categories, topics:
Climate Change, Environment
Last updated:
apr 23, 2017
Indicators value changes by year
Minimum:
66.326
jan 1, 2003
Maximum:
1.271K
jan 1, 2006
At the date of observation
Value
Absolute change
Change from previous value
jan 1, 1971
164.976
+164.976
0.0%
jan 1, 1972
219.078
+54.102
32.79%
jan 1, 1973
226.004
+6.926
3.16%
jan 1, 1974
232.93
+6.926
3.06%
jan 1, 1975
287.036
+54.106
23.23%
jan 1, 1976
297.325
+10.289
3.58%
jan 1, 1977
253.708
-43.617
-14.67%
jan 1, 1978
311.177
+57.469
22.65%
jan 1, 1979
321.466
+10.289
3.31%
jan 1, 1980
483.372
+161.906
50.36%
jan 1, 1981
402.661
-80.711
-16.7%
jan 1, 1982
315.242
-87.419
-21.71%
jan 1, 1983
574.856
+259.614
82.35%
jan 1, 1984
393.089
-181.767
-31.62%
jan 1, 1985
453.906
+60.817
15.47%
jan 1, 1986
464.195
+10.289
2.27%
jan 1, 1987
525.029
+60.834
13.11%
jan 1, 1988
585.862
+60.833
11.59%
jan 1, 1989
599.514
+13.652
2.33%
jan 1, 1990
512.077
-87.437
-14.58%
jan 1, 1991
515.64
+3.563
0.7%
jan 1, 1992
670.842
+155.202
30.1%
jan 1, 1993
536.262
-134.58
-20.06%
jan 1, 1994
640.937
+104.674
19.52%
jan 1, 1995
600.704
-40.233
-6.28%
jan 1, 1996
597.563
-3.141
-0.52%
jan 1, 1997
651.692
+54.129
9.06%
jan 1, 1998
513.75
-137.943
-21.17%
jan 1, 1999
422.09
-91.66
-17.84%
jan 1, 2000
226.534
-195.556
-46.33%
jan 1, 2001
998.885
+772.351
340.94%
jan 1, 2002
885.549
-113.336
-11.35%
jan 1, 2003
66.326
-819.223
-92.51%
jan 1, 2004
125.125
+58.799
88.65%
jan 1, 2005
119.991
-5.134
-4.1%
jan 1, 2006
1.271K
+1.151K
958.96%
jan 1, 2007
91.194
-1.179K
-92.82%
jan 1, 2008
89.101
-2.093
-2.3%
jan 1, 2009
170.158
+81.057
90.97%
jan 1, 2010
82.907
-87.251
-51.28%
jan 1, 2011
156.225
+73.318
88.43%
jan 1, 2012
156.225
0.0
0.0%
jan 1, 2013
156.225
0.0
0.0%
Ranking of countries by current statistics by years


Comments: