29
/
en
AIzaSyAYiBZKx7MnpbEhh9jyipgxe19OcubqV5w
April 1, 2024
281424
Venezuela, RB
VEN
true
2
1
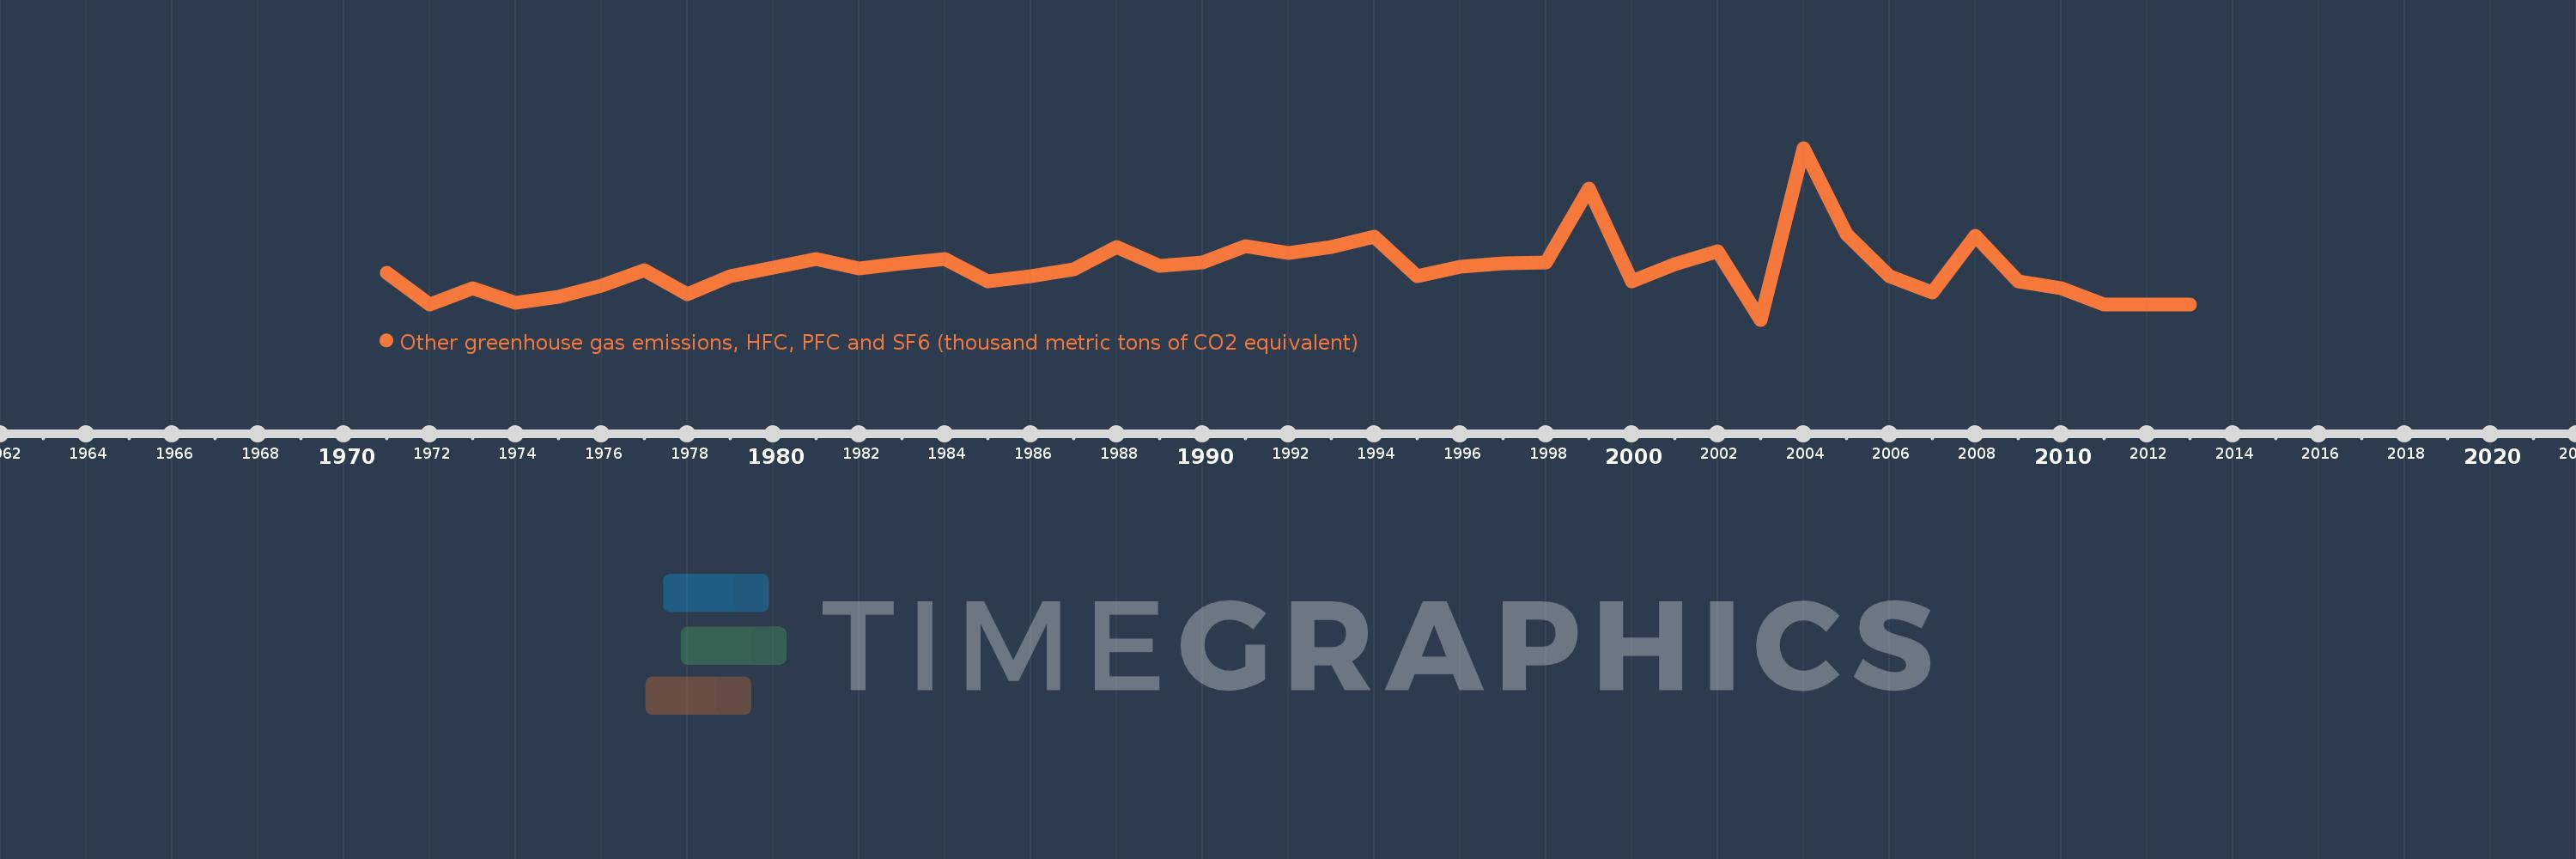
Other greenhouse gas emissions, HFC, PFC and SF6 (thousand metric tons of CO2 equivalent)
2013,2012,2011,2010,2009,2008,2007,2006,2005,2004,2003,2002,2001,2000,1999,1998,1997,1996,1995,1994,1993,1992,1991,1990,1989,1988,1987,1986,1985,1984,1983,1982,1981,1980,1979,1978,1977,1976,1975,1974,1973,1972,1971
This statistics in other country:
AfghanistanAlbaniaAlgeriaAmerican SamoaAngolaAntigua and BarbudaArab WorldArgentinaArmeniaArubaAustraliaAustriaAzerbaijanBahamas, TheBahrainBangladeshBarbadosBelarusBelgiumBelizeBeninBermudaBhutanBoliviaBosnia and HerzegovinaBotswanaBrazilBritish Virgin IslandsBrunei DarussalamBulgariaBurkina FasoBurundiCabo VerdeCambodiaCameroonCanadaCaribbean small statesCayman IslandsCentral African RepublicCentral Europe and the BalticsChadChileChinaColombiaComorosCongo, Dem. Rep.Congo, Rep.Costa RicaCote d'IvoireCroatiaCubaCyprusCzech RepublicDenmarkDjiboutiDominicaDominican RepublicEarly-demographic dividendEast Asia & PacificEast Asia & Pacific (excluding high income)East Asia & Pacific (IDA & IBRD countries)EcuadorEgypt, Arab Rep.El SalvadorEquatorial GuineaEritreaEstoniaEthiopiaEuro areaEurope & Central AsiaEurope & Central Asia (excluding high income)Europe & Central Asia (IDA & IBRD countries)European UnionFaroe IslandsFijiFinlandFragile and conflict affected situationsFranceFrench PolynesiaGabonGambia, TheGeorgiaGermanyGhanaGibraltarGreeceGreenlandGrenadaGuamGuatemalaGuineaGuinea-BissauGuyanaHaitiHeavily indebted poor countries (HIPC)High incomeHondurasHong Kong SAR, ChinaHungaryIBRD onlyIcelandIDA & IBRD totalIDA blendIDA onlyIDA totalIndiaIndonesiaIran, Islamic Rep.IraqIrelandIsraelItalyJamaicaJapanJordanKazakhstanKenyaKiribatiKorea, Dem. People’s Rep.Korea, Rep.KuwaitKyrgyz RepublicLao PDRLate-demographic dividendLatin America & Caribbean Latin America & Caribbean (excluding high income)Latin America & the Caribbean (IDA & IBRD countries)LatviaLeast developed countries: UN classificationLebanonLesothoLiberiaLibyaLithuaniaLow & middle incomeLow incomeLower middle incomeLuxembourgMacao SAR, ChinaMacedonia, FYRMadagascarMalawiMalaysiaMaldivesMaliMaltaMauritaniaMauritiusMexicoMiddle East & North AfricaMiddle East & North Africa (excluding high income)Middle East & North Africa (IDA & IBRD countries)Middle incomeMoldovaMongoliaMoroccoMozambiqueMyanmarNamibiaNauruNepalNetherlandsNew CaledoniaNew ZealandNicaraguaNigerNigeriaNorth AmericaNorwayOECD membersOmanOther small statesPacific island small statesPakistanPanamaPapua New GuineaParaguayPeruPhilippinesPolandPortugalPost-demographic dividendPre-demographic dividendPuerto RicoQatarRomaniaRussian FederationRwandaSamoaSao Tome and PrincipeSaudi ArabiaSenegalSeychellesSierra LeoneSingaporeSlovak RepublicSloveniaSmall statesSolomon IslandsSomaliaSouth AfricaSouth AsiaSouth Asia (IDA & IBRD)SpainSri LankaSt. Kitts and NevisSt. LuciaSt. Vincent and the GrenadinesSub-Saharan Africa Sub-Saharan Africa (excluding high income)Sub-Saharan Africa (IDA & IBRD countries)SudanSurinameSwazilandSwedenSwitzerlandSyrian Arab RepublicTajikistanTanzaniaThailandTimor-LesteTogoTongaTrinidad and TobagoTunisiaTurkeyTurkmenistanTurks and Caicos IslandsTuvaluUgandaUkraineUnited Arab EmiratesUnited KingdomUnited StatesUpper middle incomeUruguayUzbekistanVanuatuVenezuela, RBVietnamVirgin Islands (U.S.)WorldYemen, Rep.ZambiaZimbabwe Timeline:
This timeline shows a graph from 1971 to 2013 of Venezuela, RB. No data until 1970. Number of actual observations by date: 43.
Source name:
World Development Indicators
Source organization:
World Bank staff estimates from original source: European Commission, Joint Research Centre (JRC)/Netherlands Environmental Assessment Agency (PBL). Emission Database for Global Atmospheric Research (EDGAR): http://edgar.jrc.ec.europa.eu/.
Categories, topics:
Climate Change, Environment
Last updated:
apr 23, 2017
Indicators value changes by year
Minimum:
19.963K
jan 1, 2003
Maximum:
73.258K
jan 1, 2004
At the date of observation
Value
Absolute change
Change from previous value
jan 1, 1971
34.51K
+34.51K
0.0%
jan 1, 1972
24.574K
-9.936K
-28.79%
jan 1, 1973
29.808K
+5.234K
21.3%
jan 1, 1974
25.218K
-4.591K
-15.4%
jan 1, 1975
27.167K
+1.95K
7.73%
jan 1, 1976
30.656K
+3.488K
12.84%
jan 1, 1977
35.424K
+4.768K
15.55%
jan 1, 1978
27.89K
-7.534K
-21.27%
jan 1, 1979
33.585K
+5.695K
20.42%
jan 1, 1980
36.013K
+2.428K
7.23%
jan 1, 1981
38.887K
+2.874K
7.98%
jan 1, 1982
35.813K
-3.075K
-7.91%
jan 1, 1983
37.553K
+1.741K
4.86%
jan 1, 1984
38.684K
+1.131K
3.01%
jan 1, 1985
31.748K
-6.936K
-17.93%
jan 1, 1986
33.484K
+1.736K
5.47%
jan 1, 1987
35.501K
+2.017K
6.02%
jan 1, 1988
42.485K
+6.983K
19.67%
jan 1, 1989
36.706K
-5.779K
-13.6%
jan 1, 1990
37.654K
+948.9
2.59%
jan 1, 1991
42.735K
+5.081K
13.49%
jan 1, 1992
40.739K
-1.997K
-4.67%
jan 1, 1993
42.495K
+1.757K
4.31%
jan 1, 1994
45.791K
+3.295K
7.75%
jan 1, 1995
33.584K
-12.206K
-26.66%
jan 1, 1996
36.434K
+2.849K
8.48%
jan 1, 1997
37.453K
+1.019K
2.8%
jan 1, 1998
37.737K
+283.83
0.76%
jan 1, 1999
60.679K
+22.942K
60.8%
jan 1, 2000
31.777K
-28.901K
-47.63%
jan 1, 2001
37.201K
+5.423K
17.07%
jan 1, 2002
41.19K
+3.989K
10.72%
jan 1, 2003
19.963K
-21.227K
-51.53%
jan 1, 2004
73.258K
+53.294K
266.96%
jan 1, 2005
46.549K
-26.709K
-36.46%
jan 1, 2006
33.598K
-12.951K
-27.82%
jan 1, 2007
28.381K
-5.217K
-15.53%
jan 1, 2008
46.116K
+17.735K
62.49%
jan 1, 2009
31.998K
-14.118K
-30.61%
jan 1, 2010
29.773K
-2.225K
-6.95%
jan 1, 2011
24.605K
-5.168K
-17.36%
jan 1, 2012
24.605K
0.0
0.0%
jan 1, 2013
24.605K
0.0
0.0%
Ranking of countries by current statistics by years


Comments: