29
/
en
AIzaSyAYiBZKx7MnpbEhh9jyipgxe19OcubqV5w
April 1, 2024
33740
European Union
EUU
false
2
1
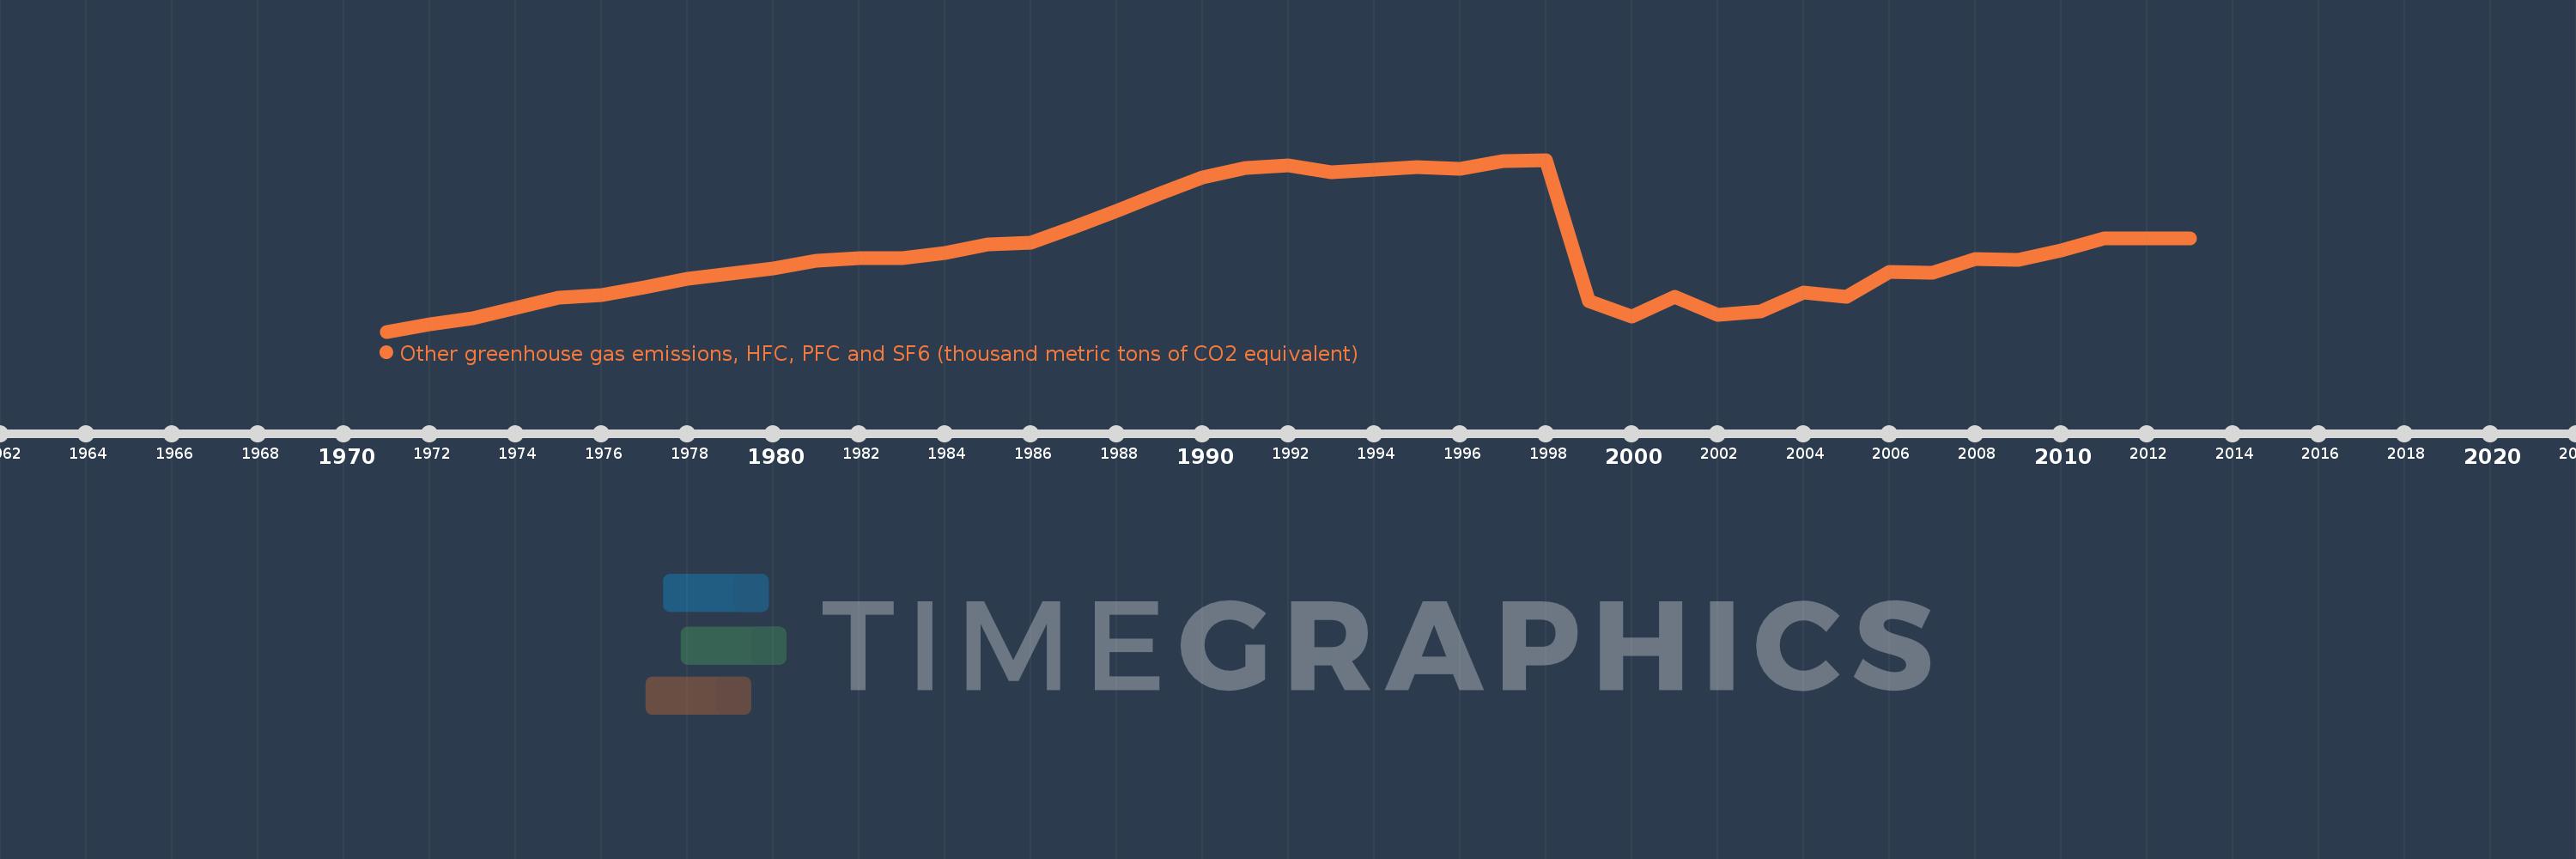
Other greenhouse gas emissions, HFC, PFC and SF6 (thousand metric tons of CO2 equivalent)
2013,2012,2011,2010,2009,2008,2007,2006,2005,2004,2003,2002,2001,2000,1999,1998,1997,1996,1995,1994,1993,1992,1991,1990,1989,1988,1987,1986,1985,1984,1983,1982,1981,1980,1979,1978,1977,1976,1975,1974,1973,1972,1971
This statistics in other country:
AfghanistanAlbaniaAlgeriaAmerican SamoaAngolaAntigua and BarbudaArab WorldArgentinaArmeniaArubaAustraliaAustriaAzerbaijanBahamas, TheBahrainBangladeshBarbadosBelarusBelgiumBelizeBeninBermudaBhutanBoliviaBosnia and HerzegovinaBotswanaBrazilBritish Virgin IslandsBrunei DarussalamBulgariaBurkina FasoBurundiCabo VerdeCambodiaCameroonCanadaCaribbean small statesCayman IslandsCentral African RepublicCentral Europe and the BalticsChadChileChinaColombiaComorosCongo, Dem. Rep.Congo, Rep.Costa RicaCote d'IvoireCroatiaCubaCyprusCzech RepublicDenmarkDjiboutiDominicaDominican RepublicEarly-demographic dividendEast Asia & PacificEast Asia & Pacific (excluding high income)East Asia & Pacific (IDA & IBRD countries)EcuadorEgypt, Arab Rep.El SalvadorEquatorial GuineaEritreaEstoniaEthiopiaEuro areaEurope & Central AsiaEurope & Central Asia (excluding high income)Europe & Central Asia (IDA & IBRD countries)European UnionFaroe IslandsFijiFinlandFragile and conflict affected situationsFranceFrench PolynesiaGabonGambia, TheGeorgiaGermanyGhanaGibraltarGreeceGreenlandGrenadaGuamGuatemalaGuineaGuinea-BissauGuyanaHaitiHeavily indebted poor countries (HIPC)High incomeHondurasHong Kong SAR, ChinaHungaryIBRD onlyIcelandIDA & IBRD totalIDA blendIDA onlyIDA totalIndiaIndonesiaIran, Islamic Rep.IraqIrelandIsraelItalyJamaicaJapanJordanKazakhstanKenyaKiribatiKorea, Dem. People’s Rep.Korea, Rep.KuwaitKyrgyz RepublicLao PDRLate-demographic dividendLatin America & Caribbean Latin America & Caribbean (excluding high income)Latin America & the Caribbean (IDA & IBRD countries)LatviaLeast developed countries: UN classificationLebanonLesothoLiberiaLibyaLithuaniaLow & middle incomeLow incomeLower middle incomeLuxembourgMacao SAR, ChinaMacedonia, FYRMadagascarMalawiMalaysiaMaldivesMaliMaltaMauritaniaMauritiusMexicoMiddle East & North AfricaMiddle East & North Africa (excluding high income)Middle East & North Africa (IDA & IBRD countries)Middle incomeMoldovaMongoliaMoroccoMozambiqueMyanmarNamibiaNauruNepalNetherlandsNew CaledoniaNew ZealandNicaraguaNigerNigeriaNorth AmericaNorwayOECD membersOmanOther small statesPacific island small statesPakistanPanamaPapua New GuineaParaguayPeruPhilippinesPolandPortugalPost-demographic dividendPre-demographic dividendPuerto RicoQatarRomaniaRussian FederationRwandaSamoaSao Tome and PrincipeSaudi ArabiaSenegalSeychellesSierra LeoneSingaporeSlovak RepublicSloveniaSmall statesSolomon IslandsSomaliaSouth AfricaSouth AsiaSouth Asia (IDA & IBRD)SpainSri LankaSt. Kitts and NevisSt. LuciaSt. Vincent and the GrenadinesSub-Saharan Africa Sub-Saharan Africa (excluding high income)Sub-Saharan Africa (IDA & IBRD countries)SudanSurinameSwazilandSwedenSwitzerlandSyrian Arab RepublicTajikistanTanzaniaThailandTimor-LesteTogoTongaTrinidad and TobagoTunisiaTurkeyTurkmenistanTurks and Caicos IslandsTuvaluUgandaUkraineUnited Arab EmiratesUnited KingdomUnited StatesUpper middle incomeUruguayUzbekistanVanuatuVenezuela, RBVietnamVirgin Islands (U.S.)WorldYemen, Rep.ZambiaZimbabwe Timeline:
This timeline shows a graph from 1971 to 2013 of European Union. No data until 1970. Number of actual observations by date: 43.
Source name:
World Development Indicators
Source organization:
World Bank staff estimates from original source: European Commission, Joint Research Centre (JRC)/Netherlands Environmental Assessment Agency (PBL). Emission Database for Global Atmospheric Research (EDGAR): http://edgar.jrc.ec.europa.eu/.
Categories, topics:
Climate Change, Environment
Last updated:
apr 23, 2017
Indicators value changes by year
Minimum:
68.937K
jan 1, 1971
Maximum:
184.691K
jan 1, 1998
At the date of observation
Value
Absolute change
Change from previous value
jan 1, 1971
68.937K
+68.937K
0.0%
jan 1, 1972
73.897K
+4.96K
7.2%
jan 1, 1973
78.117K
+4.22K
5.71%
jan 1, 1974
84.782K
+6.664K
8.53%
jan 1, 1975
91.606K
+6.824K
8.05%
jan 1, 1976
93.752K
+2.146K
2.34%
jan 1, 1977
99.009K
+5.257K
5.61%
jan 1, 1978
104.768K
+5.759K
5.82%
jan 1, 1979
107.716K
+2.948K
2.81%
jan 1, 1980
111.31K
+3.594K
3.34%
jan 1, 1981
116.57K
+5.26K
4.73%
jan 1, 1982
118.667K
+2.096K
1.8%
jan 1, 1983
118.481K
-185.646
-0.16%
jan 1, 1984
121.744K
+3.263K
2.75%
jan 1, 1985
127.626K
+5.882K
4.83%
jan 1, 1986
129.081K
+1.454K
1.14%
jan 1, 1987
139.355K
+10.274K
7.96%
jan 1, 1988
150.05K
+10.696K
7.68%
jan 1, 1989
161.943K
+11.893K
7.93%
jan 1, 1990
172.964K
+11.021K
6.81%
jan 1, 1991
179.138K
+6.175K
3.57%
jan 1, 1992
180.798K
+1.66K
0.93%
jan 1, 1993
176.151K
-4.647K
-2.57%
jan 1, 1994
177.876K
+1.725K
0.98%
jan 1, 1995
179.779K
+1.903K
1.07%
jan 1, 1996
178.517K
-1.262K
-0.7%
jan 1, 1997
183.633K
+5.115K
2.87%
jan 1, 1998
184.691K
+1.059K
0.58%
jan 1, 1999
89.399K
-95.293K
-51.6%
jan 1, 2000
79.348K
-10.051K
-11.24%
jan 1, 2001
92.501K
+13.153K
16.58%
jan 1, 2002
80.39K
-12.111K
-13.09%
jan 1, 2003
82.408K
+2.018K
2.51%
jan 1, 2004
95.488K
+13.08K
15.87%
jan 1, 2005
92.322K
-3.166K
-3.32%
jan 1, 2006
109.218K
+16.895K
18.3%
jan 1, 2007
108.567K
-650.903
-0.6%
jan 1, 2008
117.759K
+9.193K
8.47%
jan 1, 2009
117.44K
-318.963
-0.27%
jan 1, 2010
123.9K
+6.46K
5.5%
jan 1, 2011
131.523K
+7.623K
6.15%
jan 1, 2012
131.523K
0.0
0.0%
jan 1, 2013
131.523K
0.0
0.0%
Ranking of countries by current statistics by years


Comments: