29
/
en
AIzaSyAYiBZKx7MnpbEhh9jyipgxe19OcubqV5w
April 1, 2024
226256
Portugal
PRT
true
2
1
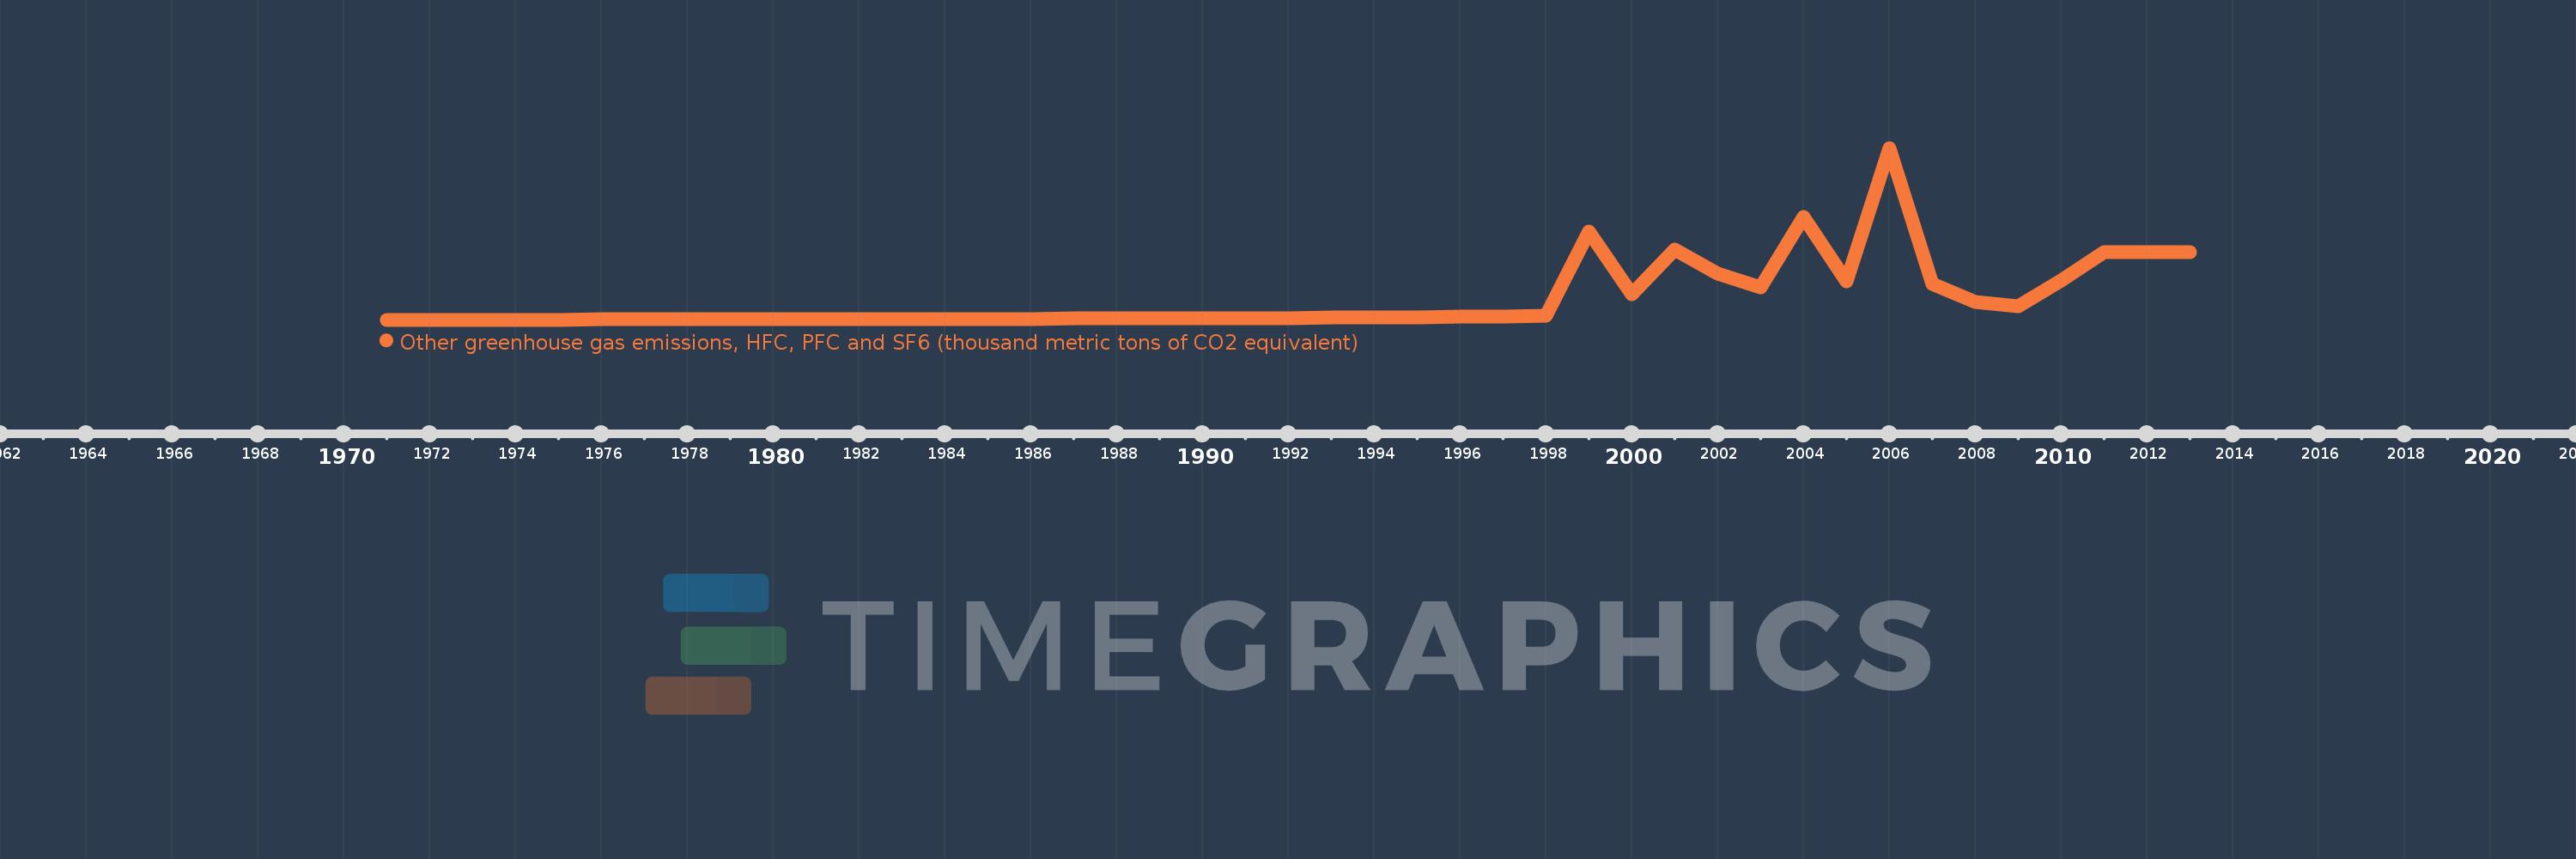
Other greenhouse gas emissions, HFC, PFC and SF6 (thousand metric tons of CO2 equivalent)
2013,2012,2011,2010,2009,2008,2007,2006,2005,2004,2003,2002,2001,2000,1999,1998,1997,1996,1995,1994,1993,1992,1991,1990,1989,1988,1987,1986,1985,1984,1983,1982,1981,1980,1979,1978,1977,1976,1975,1974,1973,1972,1971
This statistics in other country:
AfghanistanAlbaniaAlgeriaAmerican SamoaAngolaAntigua and BarbudaArab WorldArgentinaArmeniaArubaAustraliaAustriaAzerbaijanBahamas, TheBahrainBangladeshBarbadosBelarusBelgiumBelizeBeninBermudaBhutanBoliviaBosnia and HerzegovinaBotswanaBrazilBritish Virgin IslandsBrunei DarussalamBulgariaBurkina FasoBurundiCabo VerdeCambodiaCameroonCanadaCaribbean small statesCayman IslandsCentral African RepublicCentral Europe and the BalticsChadChileChinaColombiaComorosCongo, Dem. Rep.Congo, Rep.Costa RicaCote d'IvoireCroatiaCubaCyprusCzech RepublicDenmarkDjiboutiDominicaDominican RepublicEarly-demographic dividendEast Asia & PacificEast Asia & Pacific (excluding high income)East Asia & Pacific (IDA & IBRD countries)EcuadorEgypt, Arab Rep.El SalvadorEquatorial GuineaEritreaEstoniaEthiopiaEuro areaEurope & Central AsiaEurope & Central Asia (excluding high income)Europe & Central Asia (IDA & IBRD countries)European UnionFaroe IslandsFijiFinlandFragile and conflict affected situationsFranceFrench PolynesiaGabonGambia, TheGeorgiaGermanyGhanaGibraltarGreeceGreenlandGrenadaGuamGuatemalaGuineaGuinea-BissauGuyanaHaitiHeavily indebted poor countries (HIPC)High incomeHondurasHong Kong SAR, ChinaHungaryIBRD onlyIcelandIDA & IBRD totalIDA blendIDA onlyIDA totalIndiaIndonesiaIran, Islamic Rep.IraqIrelandIsraelItalyJamaicaJapanJordanKazakhstanKenyaKiribatiKorea, Dem. People’s Rep.Korea, Rep.KuwaitKyrgyz RepublicLao PDRLate-demographic dividendLatin America & Caribbean Latin America & Caribbean (excluding high income)Latin America & the Caribbean (IDA & IBRD countries)LatviaLeast developed countries: UN classificationLebanonLesothoLiberiaLibyaLithuaniaLow & middle incomeLow incomeLower middle incomeLuxembourgMacao SAR, ChinaMacedonia, FYRMadagascarMalawiMalaysiaMaldivesMaliMaltaMauritaniaMauritiusMexicoMiddle East & North AfricaMiddle East & North Africa (excluding high income)Middle East & North Africa (IDA & IBRD countries)Middle incomeMoldovaMongoliaMoroccoMozambiqueMyanmarNamibiaNauruNepalNetherlandsNew CaledoniaNew ZealandNicaraguaNigerNigeriaNorth AmericaNorwayOECD membersOmanOther small statesPacific island small statesPakistanPanamaPapua New GuineaParaguayPeruPhilippinesPolandPortugalPost-demographic dividendPre-demographic dividendPuerto RicoQatarRomaniaRussian FederationRwandaSamoaSao Tome and PrincipeSaudi ArabiaSenegalSeychellesSierra LeoneSingaporeSlovak RepublicSloveniaSmall statesSolomon IslandsSomaliaSouth AfricaSouth AsiaSouth Asia (IDA & IBRD)SpainSri LankaSt. Kitts and NevisSt. LuciaSt. Vincent and the GrenadinesSub-Saharan Africa Sub-Saharan Africa (excluding high income)Sub-Saharan Africa (IDA & IBRD countries)SudanSurinameSwazilandSwedenSwitzerlandSyrian Arab RepublicTajikistanTanzaniaThailandTimor-LesteTogoTongaTrinidad and TobagoTunisiaTurkeyTurkmenistanTurks and Caicos IslandsTuvaluUgandaUkraineUnited Arab EmiratesUnited KingdomUnited StatesUpper middle incomeUruguayUzbekistanVanuatuVenezuela, RBVietnamVirgin Islands (U.S.)WorldYemen, Rep.ZambiaZimbabwe Timeline:
This timeline shows a graph from 1971 to 2013 of Portugal. No data until 1970. Number of actual observations by date: 43.
Source name:
World Development Indicators
Source organization:
World Bank staff estimates from original source: European Commission, Joint Research Centre (JRC)/Netherlands Environmental Assessment Agency (PBL). Emission Database for Global Atmospheric Research (EDGAR): http://edgar.jrc.ec.europa.eu/.
Categories, topics:
Climate Change, Environment
Last updated:
apr 23, 2017
Indicators value changes by year
Maximum:
14.604K
jan 1, 2006
At the date of observation
Value
Absolute change
Change from previous value
jan 1, 1971
6.51
+6.51
0.0%
jan 1, 1972
12.18
+5.67
87.1%
jan 1, 1973
14.781
+2.6
21.35%
jan 1, 1974
20.591
+5.81
39.31%
jan 1, 1975
20.101
-0.49
-2.38%
jan 1, 1976
28.851
+8.75
43.53%
jan 1, 1977
37.181
+8.33
28.87%
jan 1, 1978
44.812
+7.63
20.52%
jan 1, 1979
54.142
+9.33
20.82%
jan 1, 1980
66.272
+12.13
22.4%
jan 1, 1981
73.63
+7.358
11.1%
jan 1, 1982
76.48
+2.85
3.87%
jan 1, 1983
81.02
+4.54
5.94%
jan 1, 1984
83.75
+2.73
3.37%
jan 1, 1985
79.59
-4.16
-4.97%
jan 1, 1986
90.81
+11.22
14.1%
jan 1, 1987
111.48
+20.67
22.76%
jan 1, 1988
126.05
+14.57
13.07%
jan 1, 1989
136.21
+10.16
8.06%
jan 1, 1990
146.78
+10.57
7.76%
jan 1, 1991
165.194
+18.414
12.55%
jan 1, 1992
161.962
-3.232
-1.96%
jan 1, 1993
180.072
+18.11
11.18%
jan 1, 1994
177.373
-2.699
-1.5%
jan 1, 1995
201.415
+24.041
13.55%
jan 1, 1996
240.565
+39.151
19.44%
jan 1, 1997
287.967
+47.401
19.7%
jan 1, 1998
333.078
+45.111
15.67%
jan 1, 1999
7.503K
+7.17K
2.15K%
jan 1, 2000
2.154K
-5.348K
-71.28%
jan 1, 2001
5.971K
+3.817K
177.16%
jan 1, 2002
3.96K
-2.011K
-33.68%
jan 1, 2003
2.757K
-1.204K
-30.39%
jan 1, 2004
8.76K
+6.003K
217.75%
jan 1, 2005
3.302K
-5.458K
-62.3%
jan 1, 2006
14.604K
+11.301K
342.22%
jan 1, 2007
3.043K
-11.56K
-79.16%
jan 1, 2008
1.485K
-1.558K
-51.2%
jan 1, 2009
1.18K
-305.082
-20.54%
jan 1, 2010
3.364K
+2.184K
185.06%
jan 1, 2011
5.733K
+2.369K
70.42%
jan 1, 2012
5.733K
+0.0
0.0%
jan 1, 2013
5.733K
0.0
0.0%
Ranking of countries by current statistics by years


Comments: