29
/
en
AIzaSyAYiBZKx7MnpbEhh9jyipgxe19OcubqV5w
April 1, 2024
219983
Papua New Guinea
PNG
true
2
1
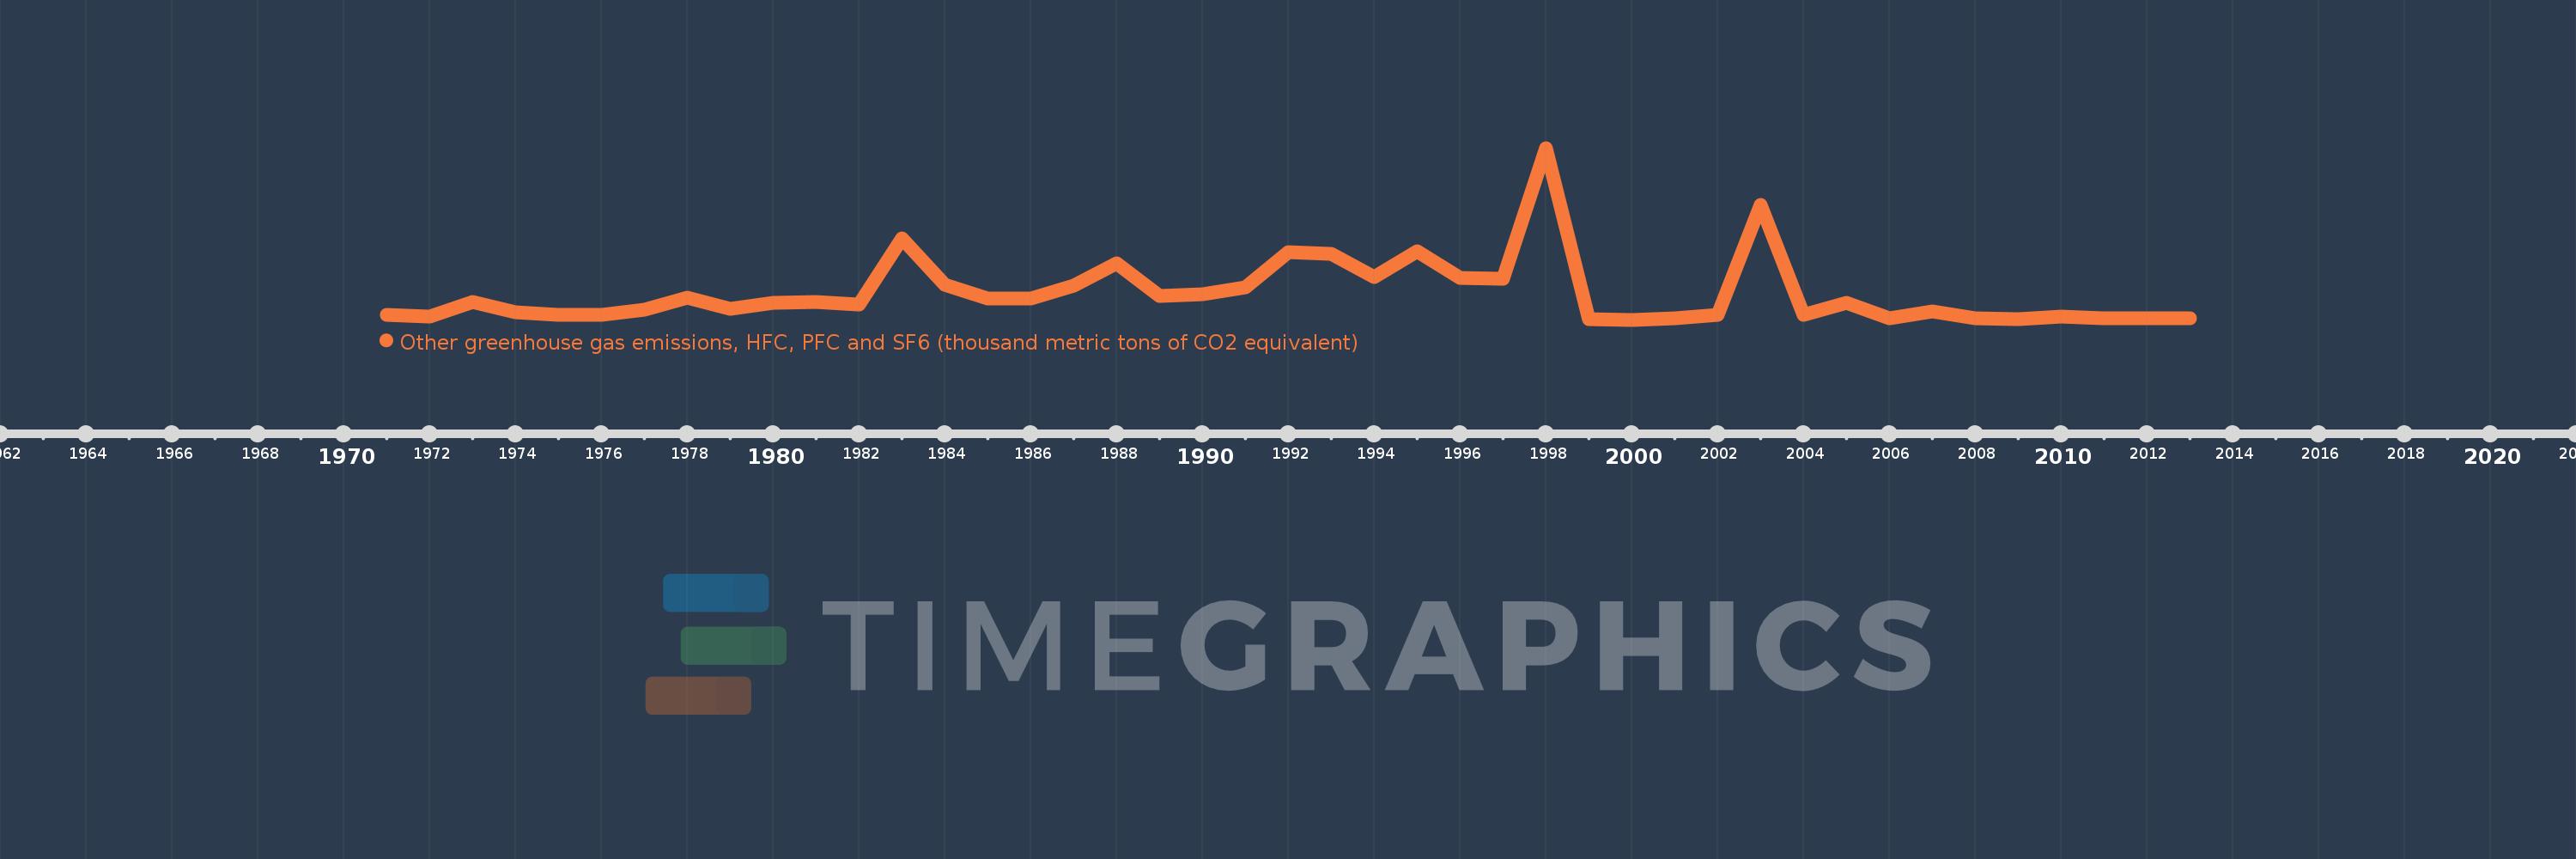
Other greenhouse gas emissions, HFC, PFC and SF6 (thousand metric tons of CO2 equivalent)
2013,2012,2011,2010,2009,2008,2007,2006,2005,2004,2003,2002,2001,2000,1999,1998,1997,1996,1995,1994,1993,1992,1991,1990,1989,1988,1987,1986,1985,1984,1983,1982,1981,1980,1979,1978,1977,1976,1975,1974,1973,1972,1971
This statistics in other country:
AfghanistanAlbaniaAlgeriaAmerican SamoaAngolaAntigua and BarbudaArab WorldArgentinaArmeniaArubaAustraliaAustriaAzerbaijanBahamas, TheBahrainBangladeshBarbadosBelarusBelgiumBelizeBeninBermudaBhutanBoliviaBosnia and HerzegovinaBotswanaBrazilBritish Virgin IslandsBrunei DarussalamBulgariaBurkina FasoBurundiCabo VerdeCambodiaCameroonCanadaCaribbean small statesCayman IslandsCentral African RepublicCentral Europe and the BalticsChadChileChinaColombiaComorosCongo, Dem. Rep.Congo, Rep.Costa RicaCote d'IvoireCroatiaCubaCyprusCzech RepublicDenmarkDjiboutiDominicaDominican RepublicEarly-demographic dividendEast Asia & PacificEast Asia & Pacific (excluding high income)East Asia & Pacific (IDA & IBRD countries)EcuadorEgypt, Arab Rep.El SalvadorEquatorial GuineaEritreaEstoniaEthiopiaEuro areaEurope & Central AsiaEurope & Central Asia (excluding high income)Europe & Central Asia (IDA & IBRD countries)European UnionFaroe IslandsFijiFinlandFragile and conflict affected situationsFranceFrench PolynesiaGabonGambia, TheGeorgiaGermanyGhanaGibraltarGreeceGreenlandGrenadaGuamGuatemalaGuineaGuinea-BissauGuyanaHaitiHeavily indebted poor countries (HIPC)High incomeHondurasHong Kong SAR, ChinaHungaryIBRD onlyIcelandIDA & IBRD totalIDA blendIDA onlyIDA totalIndiaIndonesiaIran, Islamic Rep.IraqIrelandIsraelItalyJamaicaJapanJordanKazakhstanKenyaKiribatiKorea, Dem. People’s Rep.Korea, Rep.KuwaitKyrgyz RepublicLao PDRLate-demographic dividendLatin America & Caribbean Latin America & Caribbean (excluding high income)Latin America & the Caribbean (IDA & IBRD countries)LatviaLeast developed countries: UN classificationLebanonLesothoLiberiaLibyaLithuaniaLow & middle incomeLow incomeLower middle incomeLuxembourgMacao SAR, ChinaMacedonia, FYRMadagascarMalawiMalaysiaMaldivesMaliMaltaMauritaniaMauritiusMexicoMiddle East & North AfricaMiddle East & North Africa (excluding high income)Middle East & North Africa (IDA & IBRD countries)Middle incomeMoldovaMongoliaMoroccoMozambiqueMyanmarNamibiaNauruNepalNetherlandsNew CaledoniaNew ZealandNicaraguaNigerNigeriaNorth AmericaNorwayOECD membersOmanOther small statesPacific island small statesPakistanPanamaPapua New GuineaParaguayPeruPhilippinesPolandPortugalPost-demographic dividendPre-demographic dividendPuerto RicoQatarRomaniaRussian FederationRwandaSamoaSao Tome and PrincipeSaudi ArabiaSenegalSeychellesSierra LeoneSingaporeSlovak RepublicSloveniaSmall statesSolomon IslandsSomaliaSouth AfricaSouth AsiaSouth Asia (IDA & IBRD)SpainSri LankaSt. Kitts and NevisSt. LuciaSt. Vincent and the GrenadinesSub-Saharan Africa Sub-Saharan Africa (excluding high income)Sub-Saharan Africa (IDA & IBRD countries)SudanSurinameSwazilandSwedenSwitzerlandSyrian Arab RepublicTajikistanTanzaniaThailandTimor-LesteTogoTongaTrinidad and TobagoTunisiaTurkeyTurkmenistanTurks and Caicos IslandsTuvaluUgandaUkraineUnited Arab EmiratesUnited KingdomUnited StatesUpper middle incomeUruguayUzbekistanVanuatuVenezuela, RBVietnamVirgin Islands (U.S.)WorldYemen, Rep.ZambiaZimbabwe Timeline:
This timeline shows a graph from 1971 to 2013 of Papua New Guinea. No data until 1970. Number of actual observations by date: 43.
Source name:
World Development Indicators
Source organization:
World Bank staff estimates from original source: European Commission, Joint Research Centre (JRC)/Netherlands Environmental Assessment Agency (PBL). Emission Database for Global Atmospheric Research (EDGAR): http://edgar.jrc.ec.europa.eu/.
Categories, topics:
Climate Change, Environment
Last updated:
apr 23, 2017
Indicators value changes by year
Minimum:
1.142K
jan 1, 2000
Maximum:
115.464K
jan 1, 1998
At the date of observation
Value
Absolute change
Change from previous value
jan 1, 1971
4.296K
+4.296K
0.0%
jan 1, 1972
3.388K
-907.91
-21.13%
jan 1, 1973
13.024K
+9.636K
284.4%
jan 1, 1974
6.31K
-6.714K
-51.55%
jan 1, 1975
4.408K
-1.903K
-30.15%
jan 1, 1976
4.488K
+79.84
1.81%
jan 1, 1977
7.861K
+3.373K
75.16%
jan 1, 1978
15.692K
+7.832K
99.64%
jan 1, 1979
8.122K
-7.57K
-48.24%
jan 1, 1980
12.641K
+4.519K
55.64%
jan 1, 1981
13.195K
+554.02
4.38%
jan 1, 1982
11.339K
-1.856K
-14.06%
jan 1, 1983
55.286K
+43.946K
387.56%
jan 1, 1984
24.684K
-30.602K
-55.35%
jan 1, 1985
15.057K
-9.627K
-39.0%
jan 1, 1986
15.285K
+227.81
1.51%
jan 1, 1987
24.095K
+8.81K
57.64%
jan 1, 1988
38.849K
+14.755K
61.24%
jan 1, 1989
16.726K
-22.123K
-56.95%
jan 1, 1990
17.962K
+1.236K
7.39%
jan 1, 1991
22.598K
+4.636K
25.81%
jan 1, 1992
46.309K
+23.71K
104.92%
jan 1, 1993
44.749K
-1.56K
-3.37%
jan 1, 1994
29.67K
-15.078K
-33.7%
jan 1, 1995
46.942K
+17.272K
58.21%
jan 1, 1996
28.893K
-18.049K
-38.45%
jan 1, 1997
28.612K
-281.3
-0.97%
jan 1, 1998
115.464K
+86.852K
303.55%
jan 1, 1999
1.501K
-113.963K
-98.7%
jan 1, 2000
1.142K
-359.2
-23.93%
jan 1, 2001
1.949K
+806.554
70.63%
jan 1, 2002
4.117K
+2.168K
111.26%
jan 1, 2003
77.628K
+73.511K
1.79K%
jan 1, 2004
4.157K
-73.471K
-94.65%
jan 1, 2005
12.679K
+8.522K
205.03%
jan 1, 2006
2.284K
-10.395K
-81.99%
jan 1, 2007
6.543K
+4.259K
186.48%
jan 1, 2008
2.282K
-4.261K
-65.12%
jan 1, 2009
1.462K
-819.8
-35.92%
jan 1, 2010
3.076K
+1.613K
110.31%
jan 1, 2011
2.188K
-887.6
-28.86%
jan 1, 2012
2.188K
0.0
0.0%
jan 1, 2013
2.188K
+0.0
0.0%
Ranking of countries by current statistics by years


Comments: