29
/
en
AIzaSyAYiBZKx7MnpbEhh9jyipgxe19OcubqV5w
April 1, 2024
276984
United States
USA
true
2
1
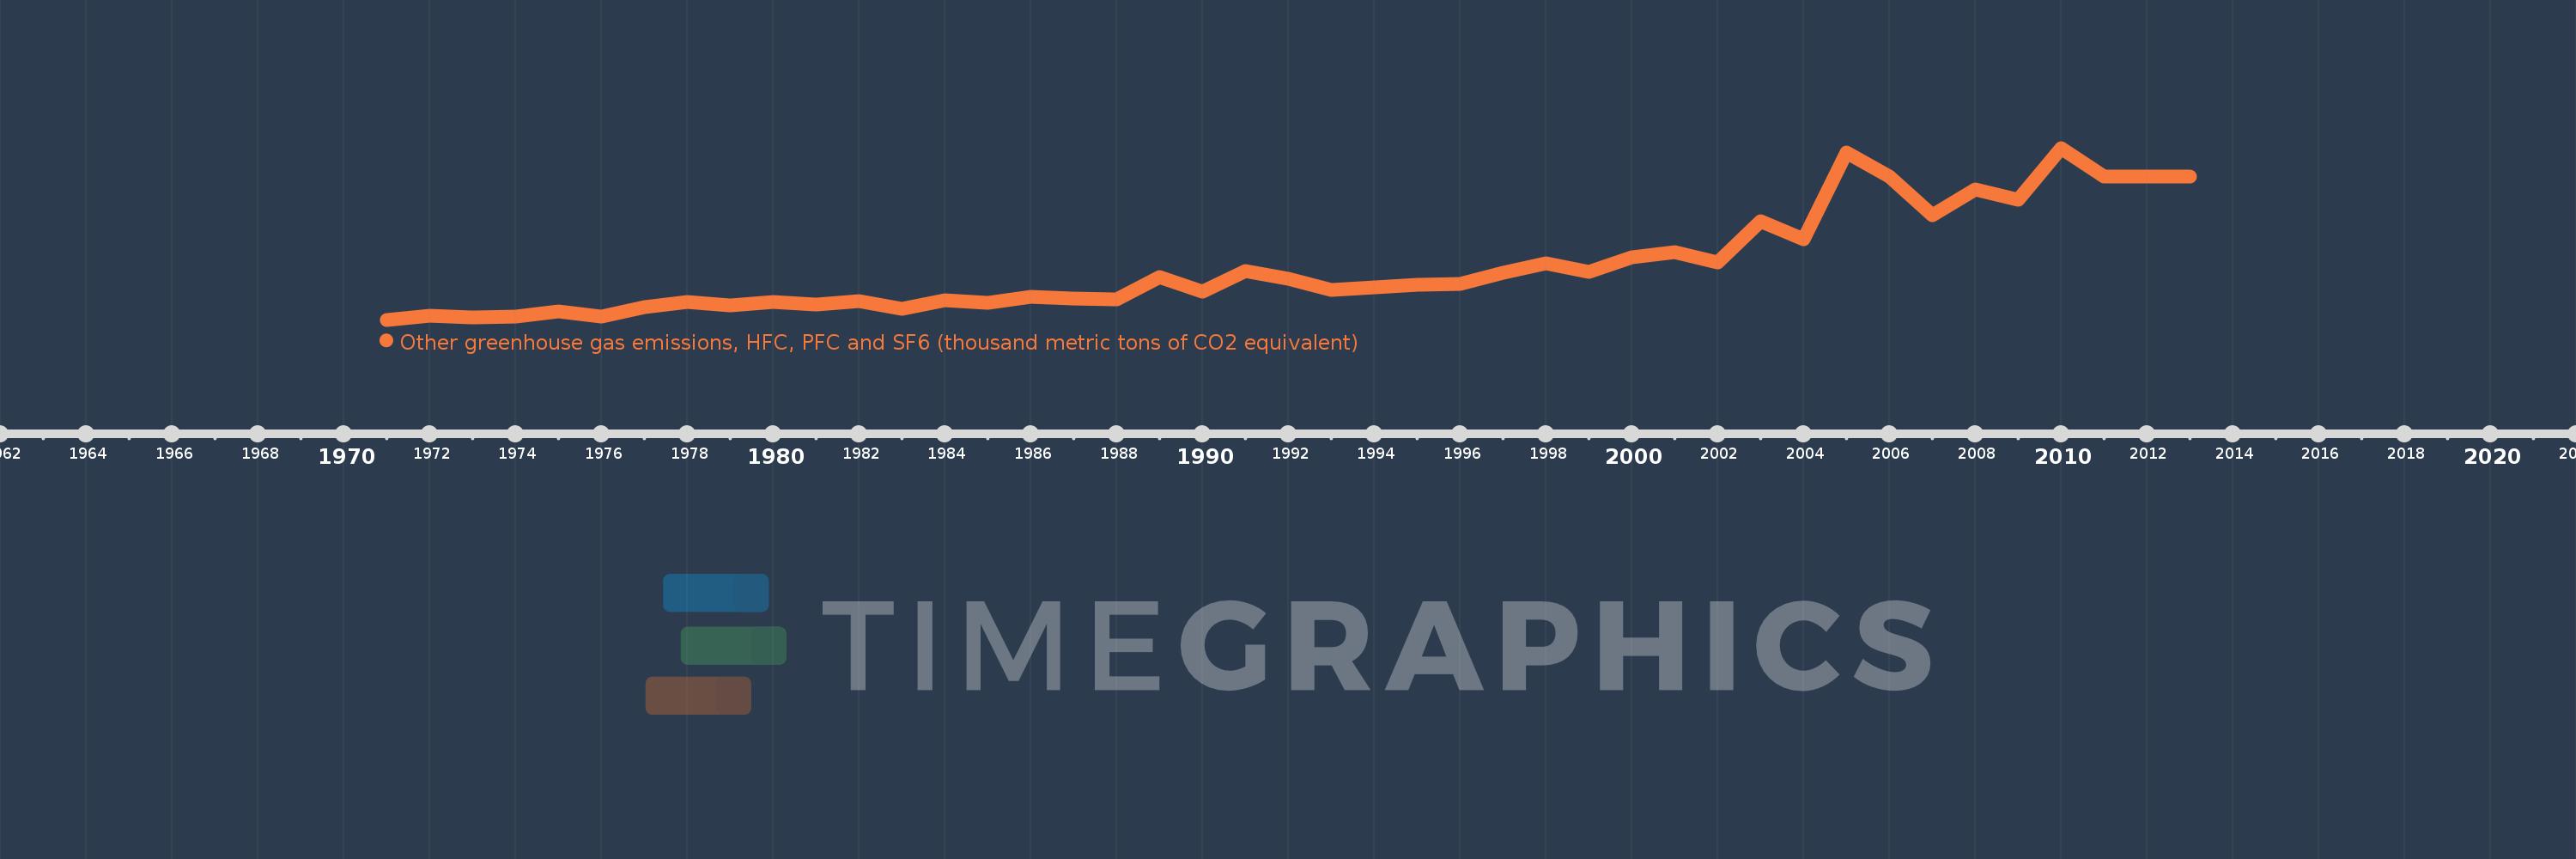
Other greenhouse gas emissions, HFC, PFC and SF6 (thousand metric tons of CO2 equivalent)
2013,2012,2011,2010,2009,2008,2007,2006,2005,2004,2003,2002,2001,2000,1999,1998,1997,1996,1995,1994,1993,1992,1991,1990,1989,1988,1987,1986,1985,1984,1983,1982,1981,1980,1979,1978,1977,1976,1975,1974,1973,1972,1971
This statistics in other country:
AfghanistanAlbaniaAlgeriaAmerican SamoaAngolaAntigua and BarbudaArab WorldArgentinaArmeniaArubaAustraliaAustriaAzerbaijanBahamas, TheBahrainBangladeshBarbadosBelarusBelgiumBelizeBeninBermudaBhutanBoliviaBosnia and HerzegovinaBotswanaBrazilBritish Virgin IslandsBrunei DarussalamBulgariaBurkina FasoBurundiCabo VerdeCambodiaCameroonCanadaCaribbean small statesCayman IslandsCentral African RepublicCentral Europe and the BalticsChadChileChinaColombiaComorosCongo, Dem. Rep.Congo, Rep.Costa RicaCote d'IvoireCroatiaCubaCyprusCzech RepublicDenmarkDjiboutiDominicaDominican RepublicEarly-demographic dividendEast Asia & PacificEast Asia & Pacific (excluding high income)East Asia & Pacific (IDA & IBRD countries)EcuadorEgypt, Arab Rep.El SalvadorEquatorial GuineaEritreaEstoniaEthiopiaEuro areaEurope & Central AsiaEurope & Central Asia (excluding high income)Europe & Central Asia (IDA & IBRD countries)European UnionFaroe IslandsFijiFinlandFragile and conflict affected situationsFranceFrench PolynesiaGabonGambia, TheGeorgiaGermanyGhanaGibraltarGreeceGreenlandGrenadaGuamGuatemalaGuineaGuinea-BissauGuyanaHaitiHeavily indebted poor countries (HIPC)High incomeHondurasHong Kong SAR, ChinaHungaryIBRD onlyIcelandIDA & IBRD totalIDA blendIDA onlyIDA totalIndiaIndonesiaIran, Islamic Rep.IraqIrelandIsraelItalyJamaicaJapanJordanKazakhstanKenyaKiribatiKorea, Dem. People’s Rep.Korea, Rep.KuwaitKyrgyz RepublicLao PDRLate-demographic dividendLatin America & Caribbean Latin America & Caribbean (excluding high income)Latin America & the Caribbean (IDA & IBRD countries)LatviaLeast developed countries: UN classificationLebanonLesothoLiberiaLibyaLithuaniaLow & middle incomeLow incomeLower middle incomeLuxembourgMacao SAR, ChinaMacedonia, FYRMadagascarMalawiMalaysiaMaldivesMaliMaltaMauritaniaMauritiusMexicoMiddle East & North AfricaMiddle East & North Africa (excluding high income)Middle East & North Africa (IDA & IBRD countries)Middle incomeMoldovaMongoliaMoroccoMozambiqueMyanmarNamibiaNauruNepalNetherlandsNew CaledoniaNew ZealandNicaraguaNigerNigeriaNorth AmericaNorwayOECD membersOmanOther small statesPacific island small statesPakistanPanamaPapua New GuineaParaguayPeruPhilippinesPolandPortugalPost-demographic dividendPre-demographic dividendPuerto RicoQatarRomaniaRussian FederationRwandaSamoaSao Tome and PrincipeSaudi ArabiaSenegalSeychellesSierra LeoneSingaporeSlovak RepublicSloveniaSmall statesSolomon IslandsSomaliaSouth AfricaSouth AsiaSouth Asia (IDA & IBRD)SpainSri LankaSt. Kitts and NevisSt. LuciaSt. Vincent and the GrenadinesSub-Saharan Africa Sub-Saharan Africa (excluding high income)Sub-Saharan Africa (IDA & IBRD countries)SudanSurinameSwazilandSwedenSwitzerlandSyrian Arab RepublicTajikistanTanzaniaThailandTimor-LesteTogoTongaTrinidad and TobagoTunisiaTurkeyTurkmenistanTurks and Caicos IslandsTuvaluUgandaUkraineUnited Arab EmiratesUnited KingdomUnited StatesUpper middle incomeUruguayUzbekistanVanuatuVenezuela, RBVietnamVirgin Islands (U.S.)WorldYemen, Rep.ZambiaZimbabwe Timeline:
This timeline shows a graph from 1971 to 2013 of United States. No data until 1970. Number of actual observations by date: 43.
Source name:
World Development Indicators
Source organization:
World Bank staff estimates from original source: European Commission, Joint Research Centre (JRC)/Netherlands Environmental Assessment Agency (PBL). Emission Database for Global Atmospheric Research (EDGAR): http://edgar.jrc.ec.europa.eu/.
Categories, topics:
Climate Change, Environment
Last updated:
apr 23, 2017
Indicators value changes by year
Minimum:
66.973K
jan 1, 1971
Maximum:
453.215K
jan 1, 2010
At the date of observation
Value
Absolute change
Change from previous value
jan 1, 1971
66.973K
+66.973K
0.0%
jan 1, 1972
76.164K
+9.19K
13.72%
jan 1, 1973
72.881K
-3.283K
-4.31%
jan 1, 1974
74.198K
+1.317K
1.81%
jan 1, 1975
85.988K
+11.79K
15.89%
jan 1, 1976
74.305K
-11.683K
-13.59%
jan 1, 1977
94.732K
+20.427K
27.49%
jan 1, 1978
107.322K
+12.59K
13.29%
jan 1, 1979
100.102K
-7.22K
-6.73%
jan 1, 1980
106.056K
+5.954K
5.95%
jan 1, 1981
101.01K
-5.046K
-4.76%
jan 1, 1982
108.4K
+7.39K
7.32%
jan 1, 1983
91.38K
-17.02K
-15.7%
jan 1, 1984
110.107K
+18.727K
20.49%
jan 1, 1985
105.388K
-4.719K
-4.29%
jan 1, 1986
118.114K
+12.727K
12.08%
jan 1, 1987
113.831K
-4.283K
-3.63%
jan 1, 1988
112.149K
-1.683K
-1.48%
jan 1, 1989
163.522K
+51.373K
45.81%
jan 1, 1990
129.356K
-34.166K
-20.89%
jan 1, 1991
176.766K
+47.41K
36.65%
jan 1, 1992
159.557K
-17.208K
-9.74%
jan 1, 1993
133.612K
-25.945K
-16.26%
jan 1, 1994
139.95K
+6.338K
4.74%
jan 1, 1995
145.452K
+5.502K
3.93%
jan 1, 1996
148.417K
+2.965K
2.04%
jan 1, 1997
172.592K
+24.175K
16.29%
jan 1, 1998
193.266K
+20.675K
11.98%
jan 1, 1999
174.685K
-18.581K
-9.61%
jan 1, 2000
207.339K
+32.654K
18.69%
jan 1, 2001
219.155K
+11.816K
5.7%
jan 1, 2002
196.278K
-22.877K
-10.44%
jan 1, 2003
287.983K
+91.705K
46.72%
jan 1, 2004
247.81K
-40.174K
-13.95%
jan 1, 2005
442.231K
+194.421K
78.46%
jan 1, 2006
388.105K
-54.126K
-12.24%
jan 1, 2007
302.321K
-85.784K
-22.1%
jan 1, 2008
359.451K
+57.13K
18.9%
jan 1, 2009
336.368K
-23.083K
-6.42%
jan 1, 2010
453.215K
+116.847K
34.74%
jan 1, 2011
389.292K
-63.923K
-14.1%
jan 1, 2012
389.292K
+0.0
0.0%
jan 1, 2013
389.292K
0.0
0.0%
Ranking of countries by current statistics by years


Comments: