29
/
en
AIzaSyAYiBZKx7MnpbEhh9jyipgxe19OcubqV5w
April 1, 2024
105289
Chile
CHL
true
2
1
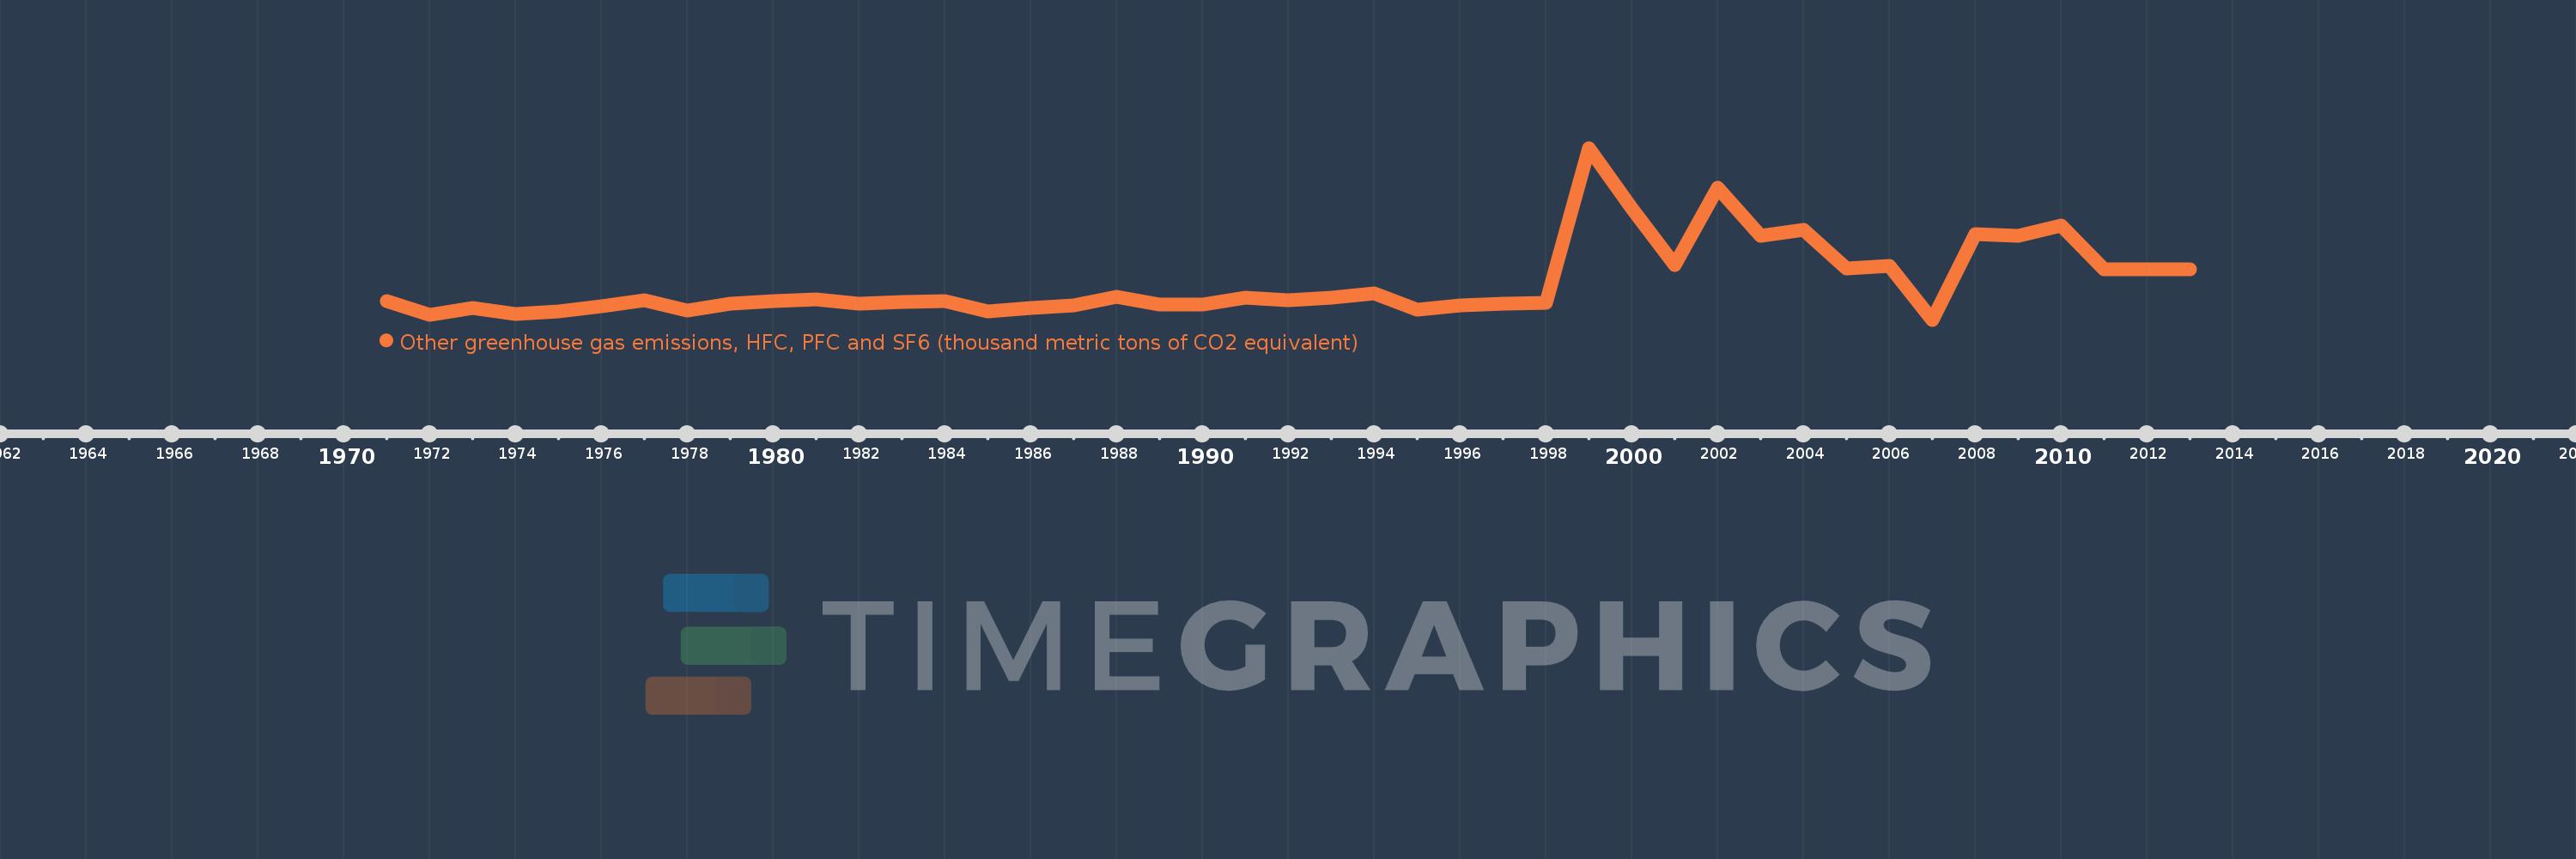
Other greenhouse gas emissions, HFC, PFC and SF6 (thousand metric tons of CO2 equivalent)
2013,2012,2011,2010,2009,2008,2007,2006,2005,2004,2003,2002,2001,2000,1999,1998,1997,1996,1995,1994,1993,1992,1991,1990,1989,1988,1987,1986,1985,1984,1983,1982,1981,1980,1979,1978,1977,1976,1975,1974,1973,1972,1971
This statistics in other country:
AfghanistanAlbaniaAlgeriaAmerican SamoaAngolaAntigua and BarbudaArab WorldArgentinaArmeniaArubaAustraliaAustriaAzerbaijanBahamas, TheBahrainBangladeshBarbadosBelarusBelgiumBelizeBeninBermudaBhutanBoliviaBosnia and HerzegovinaBotswanaBrazilBritish Virgin IslandsBrunei DarussalamBulgariaBurkina FasoBurundiCabo VerdeCambodiaCameroonCanadaCaribbean small statesCayman IslandsCentral African RepublicCentral Europe and the BalticsChadChileChinaColombiaComorosCongo, Dem. Rep.Congo, Rep.Costa RicaCote d'IvoireCroatiaCubaCyprusCzech RepublicDenmarkDjiboutiDominicaDominican RepublicEarly-demographic dividendEast Asia & PacificEast Asia & Pacific (excluding high income)East Asia & Pacific (IDA & IBRD countries)EcuadorEgypt, Arab Rep.El SalvadorEquatorial GuineaEritreaEstoniaEthiopiaEuro areaEurope & Central AsiaEurope & Central Asia (excluding high income)Europe & Central Asia (IDA & IBRD countries)European UnionFaroe IslandsFijiFinlandFragile and conflict affected situationsFranceFrench PolynesiaGabonGambia, TheGeorgiaGermanyGhanaGibraltarGreeceGreenlandGrenadaGuamGuatemalaGuineaGuinea-BissauGuyanaHaitiHeavily indebted poor countries (HIPC)High incomeHondurasHong Kong SAR, ChinaHungaryIBRD onlyIcelandIDA & IBRD totalIDA blendIDA onlyIDA totalIndiaIndonesiaIran, Islamic Rep.IraqIrelandIsraelItalyJamaicaJapanJordanKazakhstanKenyaKiribatiKorea, Dem. People’s Rep.Korea, Rep.KuwaitKyrgyz RepublicLao PDRLate-demographic dividendLatin America & Caribbean Latin America & Caribbean (excluding high income)Latin America & the Caribbean (IDA & IBRD countries)LatviaLeast developed countries: UN classificationLebanonLesothoLiberiaLibyaLithuaniaLow & middle incomeLow incomeLower middle incomeLuxembourgMacao SAR, ChinaMacedonia, FYRMadagascarMalawiMalaysiaMaldivesMaliMaltaMauritaniaMauritiusMexicoMiddle East & North AfricaMiddle East & North Africa (excluding high income)Middle East & North Africa (IDA & IBRD countries)Middle incomeMoldovaMongoliaMoroccoMozambiqueMyanmarNamibiaNauruNepalNetherlandsNew CaledoniaNew ZealandNicaraguaNigerNigeriaNorth AmericaNorwayOECD membersOmanOther small statesPacific island small statesPakistanPanamaPapua New GuineaParaguayPeruPhilippinesPolandPortugalPost-demographic dividendPre-demographic dividendPuerto RicoQatarRomaniaRussian FederationRwandaSamoaSao Tome and PrincipeSaudi ArabiaSenegalSeychellesSierra LeoneSingaporeSlovak RepublicSloveniaSmall statesSolomon IslandsSomaliaSouth AfricaSouth AsiaSouth Asia (IDA & IBRD)SpainSri LankaSt. Kitts and NevisSt. LuciaSt. Vincent and the GrenadinesSub-Saharan Africa Sub-Saharan Africa (excluding high income)Sub-Saharan Africa (IDA & IBRD countries)SudanSurinameSwazilandSwedenSwitzerlandSyrian Arab RepublicTajikistanTanzaniaThailandTimor-LesteTogoTongaTrinidad and TobagoTunisiaTurkeyTurkmenistanTurks and Caicos IslandsTuvaluUgandaUkraineUnited Arab EmiratesUnited KingdomUnited StatesUpper middle incomeUruguayUzbekistanVanuatuVenezuela, RBVietnamVirgin Islands (U.S.)WorldYemen, Rep.ZambiaZimbabwe Timeline:
This timeline shows a graph from 1971 to 2013 of Chile. No data until 1970. Number of actual observations by date: 43.
Source name:
World Development Indicators
Source organization:
World Bank staff estimates from original source: European Commission, Joint Research Centre (JRC)/Netherlands Environmental Assessment Agency (PBL). Emission Database for Global Atmospheric Research (EDGAR): http://edgar.jrc.ec.europa.eu/.
Categories, topics:
Climate Change, Environment
Last updated:
apr 23, 2017
Indicators value changes by year
Minimum:
268.457
jan 1, 2007
Maximum:
5.289K
jan 1, 1999
At the date of observation
Value
Absolute change
Change from previous value
jan 1, 1971
815.838
+815.838
0.0%
jan 1, 1972
406.885
-408.953
-50.13%
jan 1, 1973
620.1
+213.214
52.4%
jan 1, 1974
433.364
-186.736
-30.11%
jan 1, 1975
513.261
+79.897
18.44%
jan 1, 1976
652.418
+139.157
27.11%
jan 1, 1977
836.022
+183.604
28.14%
jan 1, 1978
532.11
-303.913
-36.35%
jan 1, 1979
740.503
+208.393
39.16%
jan 1, 1980
809.968
+69.465
9.38%
jan 1, 1981
874.933
+64.965
8.02%
jan 1, 1982
728.992
-145.941
-16.68%
jan 1, 1983
795.155
+66.163
9.08%
jan 1, 1984
811.977
+16.822
2.12%
jan 1, 1985
519.941
-292.036
-35.97%
jan 1, 1986
600.126
+80.185
15.42%
jan 1, 1987
697.661
+97.535
16.25%
jan 1, 1988
949.989
+252.328
36.17%
jan 1, 1989
706.393
-243.596
-25.64%
jan 1, 1990
712.884
+6.491
0.92%
jan 1, 1991
902.948
+190.064
26.66%
jan 1, 1992
832.563
-70.385
-7.8%
jan 1, 1993
917.525
+84.962
10.2%
jan 1, 1994
1.036K
+117.986
12.86%
jan 1, 1995
555.865
-479.646
-46.32%
jan 1, 1996
692.74
+136.875
24.62%
jan 1, 1997
746.65
+53.91
7.78%
jan 1, 1998
760.129
+13.479
1.81%
jan 1, 1999
5.289K
+4.528K
595.74%
jan 1, 2000
3.514K
-1.775K
-33.56%
jan 1, 2001
1.856K
-1.657K
-47.17%
jan 1, 2002
4.127K
+2.27K
122.29%
jan 1, 2003
2.718K
-1.409K
-34.14%
jan 1, 2004
2.894K
+175.703
6.46%
jan 1, 2005
1.767K
-1.126K
-38.92%
jan 1, 2006
1.836K
+69.074
3.91%
jan 1, 2007
268.457
-1.568K
-85.38%
jan 1, 2008
2.767K
+2.499K
930.77%
jan 1, 2009
2.733K
-34.015
-1.23%
jan 1, 2010
3.016K
+282.596
10.34%
jan 1, 2011
1.739K
-1.277K
-42.33%
jan 1, 2012
1.739K
+0.0
0.0%
jan 1, 2013
1.739K
0.0
0.0%
Ranking of countries by current statistics by years


Comments: