29
/
en
AIzaSyAYiBZKx7MnpbEhh9jyipgxe19OcubqV5w
April 1, 2024
234990
Saudi Arabia
SAU
true
2
1
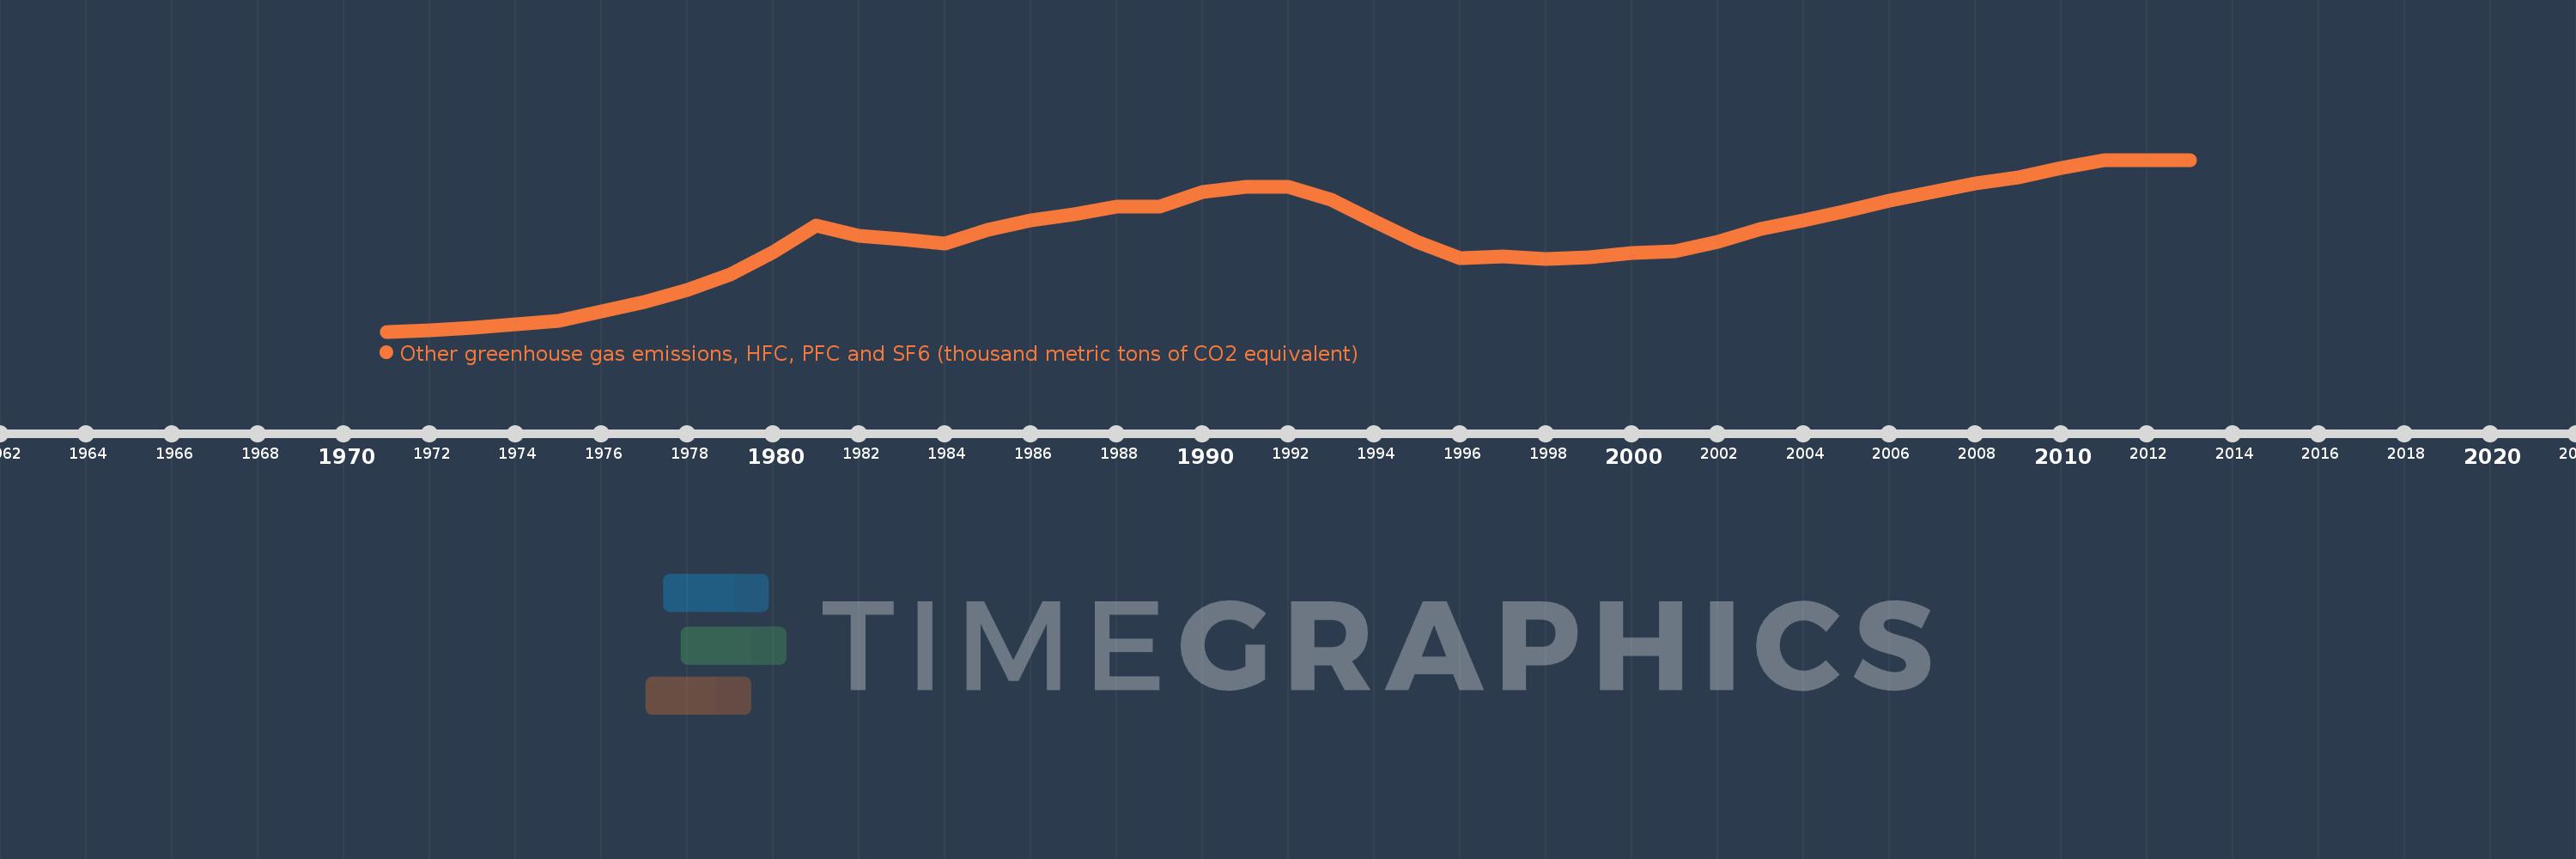
Other greenhouse gas emissions, HFC, PFC and SF6 (thousand metric tons of CO2 equivalent)
2013,2012,2011,2010,2009,2008,2007,2006,2005,2004,2003,2002,2001,2000,1999,1998,1997,1996,1995,1994,1993,1992,1991,1990,1989,1988,1987,1986,1985,1984,1983,1982,1981,1980,1979,1978,1977,1976,1975,1974,1973,1972,1971
This statistics in other country:
AfghanistanAlbaniaAlgeriaAmerican SamoaAngolaAntigua and BarbudaArab WorldArgentinaArmeniaArubaAustraliaAustriaAzerbaijanBahamas, TheBahrainBangladeshBarbadosBelarusBelgiumBelizeBeninBermudaBhutanBoliviaBosnia and HerzegovinaBotswanaBrazilBritish Virgin IslandsBrunei DarussalamBulgariaBurkina FasoBurundiCabo VerdeCambodiaCameroonCanadaCaribbean small statesCayman IslandsCentral African RepublicCentral Europe and the BalticsChadChileChinaColombiaComorosCongo, Dem. Rep.Congo, Rep.Costa RicaCote d'IvoireCroatiaCubaCyprusCzech RepublicDenmarkDjiboutiDominicaDominican RepublicEarly-demographic dividendEast Asia & PacificEast Asia & Pacific (excluding high income)East Asia & Pacific (IDA & IBRD countries)EcuadorEgypt, Arab Rep.El SalvadorEquatorial GuineaEritreaEstoniaEthiopiaEuro areaEurope & Central AsiaEurope & Central Asia (excluding high income)Europe & Central Asia (IDA & IBRD countries)European UnionFaroe IslandsFijiFinlandFragile and conflict affected situationsFranceFrench PolynesiaGabonGambia, TheGeorgiaGermanyGhanaGibraltarGreeceGreenlandGrenadaGuamGuatemalaGuineaGuinea-BissauGuyanaHaitiHeavily indebted poor countries (HIPC)High incomeHondurasHong Kong SAR, ChinaHungaryIBRD onlyIcelandIDA & IBRD totalIDA blendIDA onlyIDA totalIndiaIndonesiaIran, Islamic Rep.IraqIrelandIsraelItalyJamaicaJapanJordanKazakhstanKenyaKiribatiKorea, Dem. People’s Rep.Korea, Rep.KuwaitKyrgyz RepublicLao PDRLate-demographic dividendLatin America & Caribbean Latin America & Caribbean (excluding high income)Latin America & the Caribbean (IDA & IBRD countries)LatviaLeast developed countries: UN classificationLebanonLesothoLiberiaLibyaLithuaniaLow & middle incomeLow incomeLower middle incomeLuxembourgMacao SAR, ChinaMacedonia, FYRMadagascarMalawiMalaysiaMaldivesMaliMaltaMauritaniaMauritiusMexicoMiddle East & North AfricaMiddle East & North Africa (excluding high income)Middle East & North Africa (IDA & IBRD countries)Middle incomeMoldovaMongoliaMoroccoMozambiqueMyanmarNamibiaNauruNepalNetherlandsNew CaledoniaNew ZealandNicaraguaNigerNigeriaNorth AmericaNorwayOECD membersOmanOther small statesPacific island small statesPakistanPanamaPapua New GuineaParaguayPeruPhilippinesPolandPortugalPost-demographic dividendPre-demographic dividendPuerto RicoQatarRomaniaRussian FederationRwandaSamoaSao Tome and PrincipeSaudi ArabiaSenegalSeychellesSierra LeoneSingaporeSlovak RepublicSloveniaSmall statesSolomon IslandsSomaliaSouth AfricaSouth AsiaSouth Asia (IDA & IBRD)SpainSri LankaSt. Kitts and NevisSt. LuciaSt. Vincent and the GrenadinesSub-Saharan Africa Sub-Saharan Africa (excluding high income)Sub-Saharan Africa (IDA & IBRD countries)SudanSurinameSwazilandSwedenSwitzerlandSyrian Arab RepublicTajikistanTanzaniaThailandTimor-LesteTogoTongaTrinidad and TobagoTunisiaTurkeyTurkmenistanTurks and Caicos IslandsTuvaluUgandaUkraineUnited Arab EmiratesUnited KingdomUnited StatesUpper middle incomeUruguayUzbekistanVanuatuVenezuela, RBVietnamVirgin Islands (U.S.)WorldYemen, Rep.ZambiaZimbabwe Timeline:
This timeline shows a graph from 1971 to 2013 of Saudi Arabia. No data until 1970. Number of actual observations by date: 43.
Source name:
World Development Indicators
Source organization:
World Bank staff estimates from original source: European Commission, Joint Research Centre (JRC)/Netherlands Environmental Assessment Agency (PBL). Emission Database for Global Atmospheric Research (EDGAR): http://edgar.jrc.ec.europa.eu/.
Categories, topics:
Climate Change, Environment
Last updated:
apr 23, 2017
Indicators value changes by year
Maximum:
2.891K
jan 1, 2013
At the date of observation
Value
Absolute change
Change from previous value
jan 1, 1972
26.9
+26.9
-845.05 trl%
jan 1, 1973
61.2
+34.3
127.51%
jan 1, 1974
123.0
+61.8
100.98%
jan 1, 1975
187.0
+64.0
52.03%
jan 1, 1976
335.0
+148.0
79.14%
jan 1, 1977
497.0
+162.0
48.36%
jan 1, 1978
707.0
+210.0
42.25%
jan 1, 1979
955.0
+248.0
35.08%
jan 1, 1980
1.34K
+385.0
40.31%
jan 1, 1981
1.78K
+440.0
32.84%
jan 1, 1982
1.61K
-170.0
-9.55%
jan 1, 1983
1.56K
-50.0
-3.11%
jan 1, 1984
1.48K
-80.0
-5.13%
jan 1, 1985
1.72K
+240.0
16.22%
jan 1, 1986
1.87K
+150.0
8.72%
jan 1, 1987
1.98K
+110.0
5.88%
jan 1, 1988
2.1K
+120.0
6.06%
jan 1, 1990
2.35K
+250.0
11.9%
jan 1, 1991
2.44K
+90.052
3.83%
jan 1, 1992
2.43K
-9.717
-0.4%
jan 1, 1993
2.221K
-209.315
-8.61%
jan 1, 1994
1.854K
-367.12
-16.53%
jan 1, 1995
1.509K
-345.23
-18.62%
jan 1, 1996
1.237K
-271.57
-18.0%
jan 1, 1997
1.258K
+20.7
1.67%
jan 1, 1998
1.226K
-31.5
-2.5%
jan 1, 1999
1.248K
+21.7
1.77%
jan 1, 2000
1.323K
+74.9
6.0%
jan 1, 2001
1.349K
+25.6
1.94%
jan 1, 2002
1.516K
+167.9
12.45%
jan 1, 2003
1.721K
+204.6
13.49%
jan 1, 2004
1.865K
+144.0
8.37%
jan 1, 2005
2.026K
+161.0
8.63%
jan 1, 2006
2.2K
+174.0
8.59%
jan 1, 2007
2.352K
+152.0
6.91%
jan 1, 2008
2.492K
+140.0
5.95%
jan 1, 2009
2.599K
+107.0
4.29%
jan 1, 2010
2.757K
+158.0
6.08%
jan 1, 2011
2.891K
+134.0
4.86%
jan 1, 2012
2.891K
0.0
0.0%
jan 1, 2013
2.891K
+0.0
0.0%
Ranking of countries by current statistics by years


Comments: