29
/
en
AIzaSyAYiBZKx7MnpbEhh9jyipgxe19OcubqV5w
April 1, 2024
42762
Latin America & Caribbean (excluding high income)
LAC
false
2
1
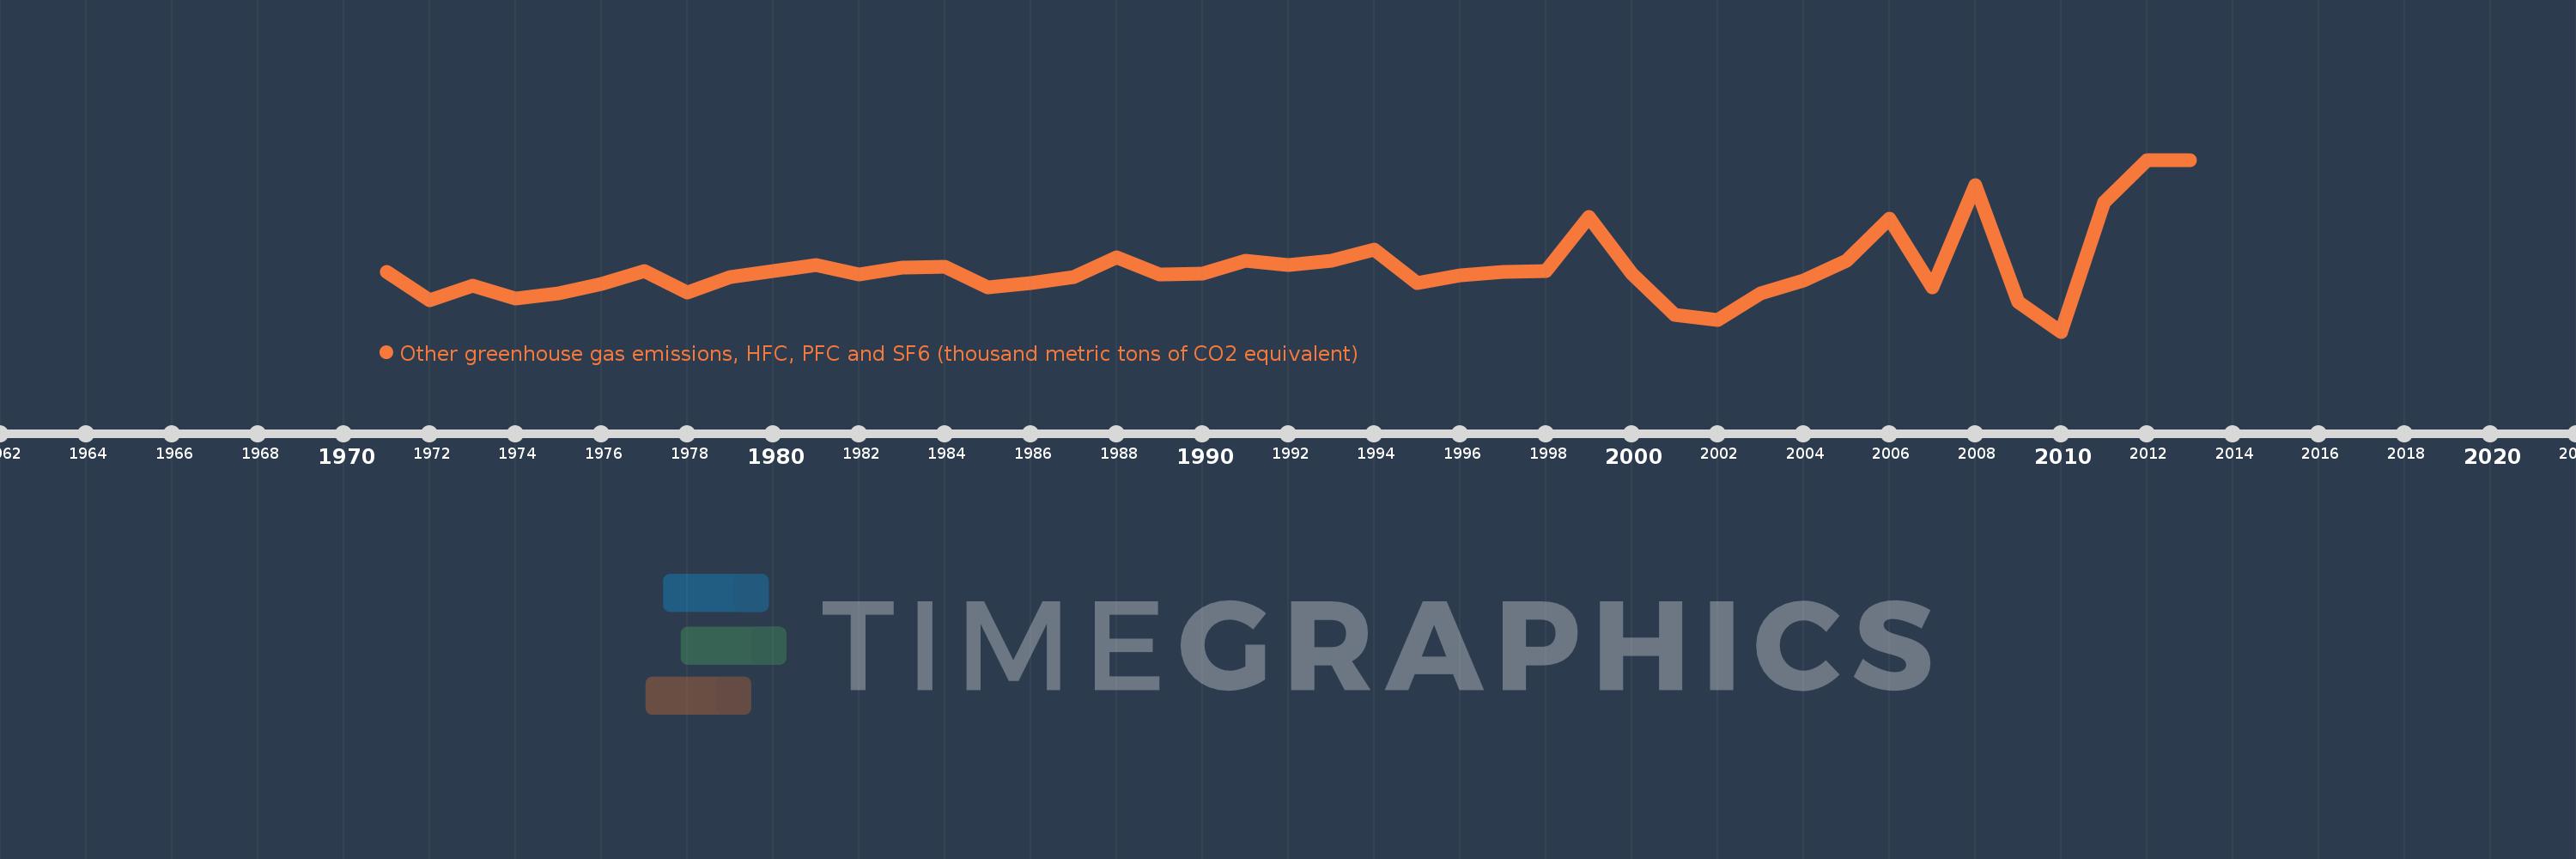
Other greenhouse gas emissions, HFC, PFC and SF6 (thousand metric tons of CO2 equivalent)
2013,2012,2011,2010,2009,2008,2007,2006,2005,2004,2003,2002,2001,2000,1999,1998,1997,1996,1995,1994,1993,1992,1991,1990,1989,1988,1987,1986,1985,1984,1983,1982,1981,1980,1979,1978,1977,1976,1975,1974,1973,1972,1971
This statistics in other country:
AfghanistanAlbaniaAlgeriaAmerican SamoaAngolaAntigua and BarbudaArab WorldArgentinaArmeniaArubaAustraliaAustriaAzerbaijanBahamas, TheBahrainBangladeshBarbadosBelarusBelgiumBelizeBeninBermudaBhutanBoliviaBosnia and HerzegovinaBotswanaBrazilBritish Virgin IslandsBrunei DarussalamBulgariaBurkina FasoBurundiCabo VerdeCambodiaCameroonCanadaCaribbean small statesCayman IslandsCentral African RepublicCentral Europe and the BalticsChadChileChinaColombiaComorosCongo, Dem. Rep.Congo, Rep.Costa RicaCote d'IvoireCroatiaCubaCyprusCzech RepublicDenmarkDjiboutiDominicaDominican RepublicEarly-demographic dividendEast Asia & PacificEast Asia & Pacific (excluding high income)East Asia & Pacific (IDA & IBRD countries)EcuadorEgypt, Arab Rep.El SalvadorEquatorial GuineaEritreaEstoniaEthiopiaEuro areaEurope & Central AsiaEurope & Central Asia (excluding high income)Europe & Central Asia (IDA & IBRD countries)European UnionFaroe IslandsFijiFinlandFragile and conflict affected situationsFranceFrench PolynesiaGabonGambia, TheGeorgiaGermanyGhanaGibraltarGreeceGreenlandGrenadaGuamGuatemalaGuineaGuinea-BissauGuyanaHaitiHeavily indebted poor countries (HIPC)High incomeHondurasHong Kong SAR, ChinaHungaryIBRD onlyIcelandIDA & IBRD totalIDA blendIDA onlyIDA totalIndiaIndonesiaIran, Islamic Rep.IraqIrelandIsraelItalyJamaicaJapanJordanKazakhstanKenyaKiribatiKorea, Dem. People’s Rep.Korea, Rep.KuwaitKyrgyz RepublicLao PDRLate-demographic dividendLatin America & Caribbean Latin America & Caribbean (excluding high income)Latin America & the Caribbean (IDA & IBRD countries)LatviaLeast developed countries: UN classificationLebanonLesothoLiberiaLibyaLithuaniaLow & middle incomeLow incomeLower middle incomeLuxembourgMacao SAR, ChinaMacedonia, FYRMadagascarMalawiMalaysiaMaldivesMaliMaltaMauritaniaMauritiusMexicoMiddle East & North AfricaMiddle East & North Africa (excluding high income)Middle East & North Africa (IDA & IBRD countries)Middle incomeMoldovaMongoliaMoroccoMozambiqueMyanmarNamibiaNauruNepalNetherlandsNew CaledoniaNew ZealandNicaraguaNigerNigeriaNorth AmericaNorwayOECD membersOmanOther small statesPacific island small statesPakistanPanamaPapua New GuineaParaguayPeruPhilippinesPolandPortugalPost-demographic dividendPre-demographic dividendPuerto RicoQatarRomaniaRussian FederationRwandaSamoaSao Tome and PrincipeSaudi ArabiaSenegalSeychellesSierra LeoneSingaporeSlovak RepublicSloveniaSmall statesSolomon IslandsSomaliaSouth AfricaSouth AsiaSouth Asia (IDA & IBRD)SpainSri LankaSt. Kitts and NevisSt. LuciaSt. Vincent and the GrenadinesSub-Saharan Africa Sub-Saharan Africa (excluding high income)Sub-Saharan Africa (IDA & IBRD countries)SudanSurinameSwazilandSwedenSwitzerlandSyrian Arab RepublicTajikistanTanzaniaThailandTimor-LesteTogoTongaTrinidad and TobagoTunisiaTurkeyTurkmenistanTurks and Caicos IslandsTuvaluUgandaUkraineUnited Arab EmiratesUnited KingdomUnited StatesUpper middle incomeUruguayUzbekistanVanuatuVenezuela, RBVietnamVirgin Islands (U.S.)WorldYemen, Rep.ZambiaZimbabwe Timeline:
This timeline shows a graph from 1971 to 2013 of Latin America & Caribbean (excluding high income). No data until 1970. Number of actual observations by date: 43.
Source name:
World Development Indicators
Source organization:
World Bank staff estimates from original source: European Commission, Joint Research Centre (JRC)/Netherlands Environmental Assessment Agency (PBL). Emission Database for Global Atmospheric Research (EDGAR): http://edgar.jrc.ec.europa.eu/.
Categories, topics:
Climate Change, Environment
Last updated:
apr 23, 2017
Indicators value changes by year
Minimum:
446.489K
jan 1, 2010
Maximum:
2.518 mln
jan 1, 2012
At the date of observation
Value
Absolute change
Change from previous value
jan 1, 1971
1.165 mln
+1.165 mln
0.0%
jan 1, 1972
828.963K
-336.199K
-28.85%
jan 1, 1973
1.002 mln
+173.169K
20.89%
jan 1, 1974
842.509K
-159.623K
-15.93%
jan 1, 1975
905.942K
+63.434K
7.53%
jan 1, 1976
1.021 mln
+114.647K
12.66%
jan 1, 1977
1.174 mln
+153.385K
15.03%
jan 1, 1978
919.014K
-254.961K
-21.72%
jan 1, 1979
1.104 mln
+185.364K
20.17%
jan 1, 1980
1.18 mln
+75.723K
6.86%
jan 1, 1981
1.248 mln
+68.343K
5.79%
jan 1, 1982
1.132 mln
-116.653K
-9.34%
jan 1, 1983
1.214 mln
+81.818K
7.23%
jan 1, 1984
1.224 mln
+10.122K
0.83%
jan 1, 1985
982.599K
-241.131K
-19.7%
jan 1, 1986
1.037 mln
+54.247K
5.52%
jan 1, 1987
1.104 mln
+67.079K
6.47%
jan 1, 1988
1.339 mln
+235.422K
21.33%
jan 1, 1989
1.139 mln
-200.158K
-14.94%
jan 1, 1990
1.145 mln
+5.492K
0.48%
jan 1, 1991
1.305 mln
+160.631K
14.03%
jan 1, 1992
1.25 mln
-55.208K
-4.23%
jan 1, 1993
1.306 mln
+56.136K
4.49%
jan 1, 1994
1.434 mln
+127.826K
9.79%
jan 1, 1995
1.032 mln
-401.871K
-28.02%
jan 1, 1996
1.128 mln
+95.955K
9.3%
jan 1, 1997
1.171 mln
+42.433K
3.76%
jan 1, 1998
1.18 mln
+9.074K
0.78%
jan 1, 1999
1.832 mln
+652.764K
55.34%
jan 1, 2000
1.143 mln
-689.156K
-37.61%
jan 1, 2001
643.378K
-499.889K
-43.72%
jan 1, 2002
591.479K
-51.899K
-8.07%
jan 1, 2003
910.912K
+319.433K
54.01%
jan 1, 2004
1.06 mln
+149.059K
16.36%
jan 1, 2005
1.306 mln
+245.814K
23.19%
jan 1, 2006
1.812 mln
+506.712K
38.81%
jan 1, 2007
977.646K
-834.852K
-46.06%
jan 1, 2008
2.212 mln
+1.234 mln
126.23%
jan 1, 2009
802.475K
-1.409 mln
-63.72%
jan 1, 2010
446.489K
-355.985K
-44.36%
jan 1, 2011
2.001 mln
+1.554 mln
348.14%
jan 1, 2012
2.518 mln
+517.283K
25.85%
jan 1, 2013
2.518 mln
0.0
0.0%
Ranking of countries by current statistics by years


Comments: