29
/
en
AIzaSyAYiBZKx7MnpbEhh9jyipgxe19OcubqV5w
April 1, 2024
91601
Brazil
BRA
true
2
1
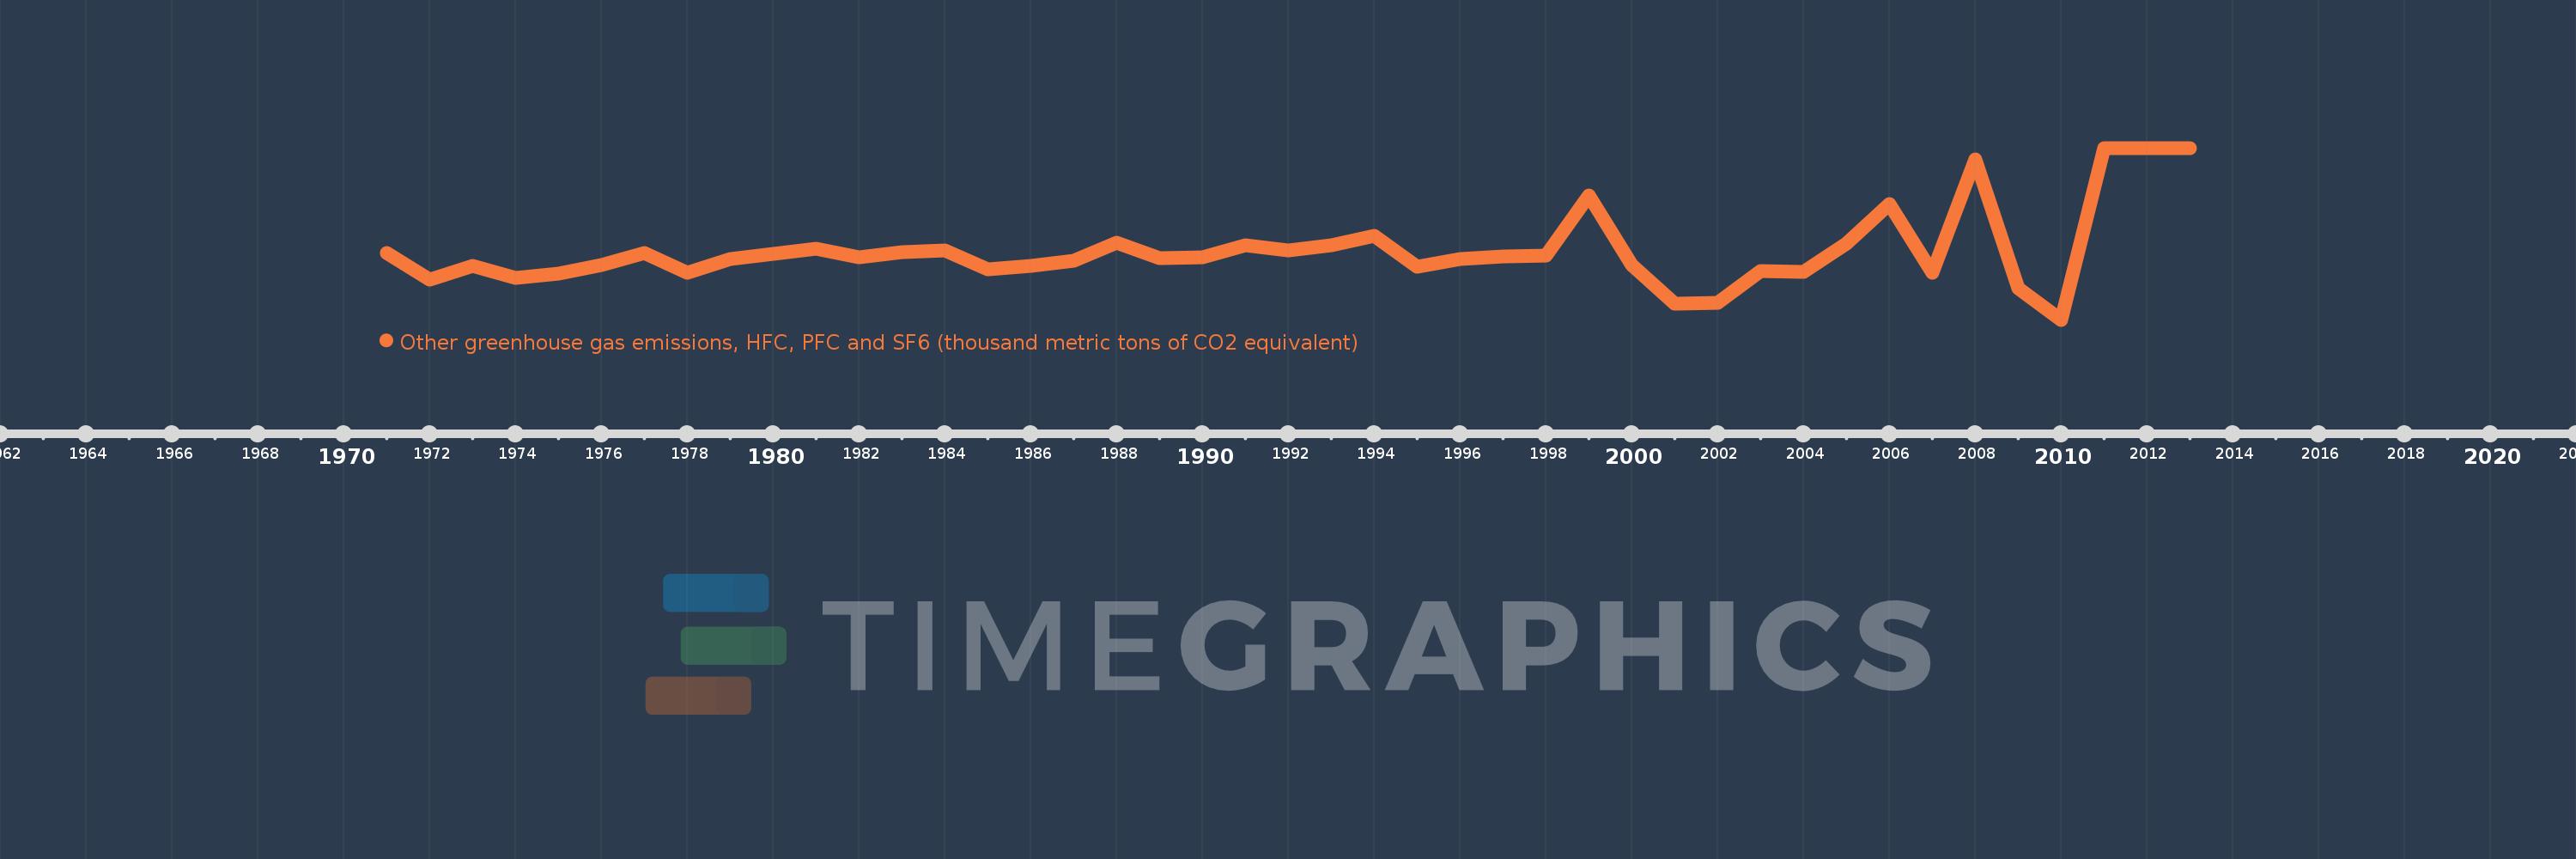
Other greenhouse gas emissions, HFC, PFC and SF6 (thousand metric tons of CO2 equivalent)
2013,2012,2011,2010,2009,2008,2007,2006,2005,2004,2003,2002,2001,2000,1999,1998,1997,1996,1995,1994,1993,1992,1991,1990,1989,1988,1987,1986,1985,1984,1983,1982,1981,1980,1979,1978,1977,1976,1975,1974,1973,1972,1971
This statistics in other country:
AfghanistanAlbaniaAlgeriaAmerican SamoaAngolaAntigua and BarbudaArab WorldArgentinaArmeniaArubaAustraliaAustriaAzerbaijanBahamas, TheBahrainBangladeshBarbadosBelarusBelgiumBelizeBeninBermudaBhutanBoliviaBosnia and HerzegovinaBotswanaBrazilBritish Virgin IslandsBrunei DarussalamBulgariaBurkina FasoBurundiCabo VerdeCambodiaCameroonCanadaCaribbean small statesCayman IslandsCentral African RepublicCentral Europe and the BalticsChadChileChinaColombiaComorosCongo, Dem. Rep.Congo, Rep.Costa RicaCote d'IvoireCroatiaCubaCyprusCzech RepublicDenmarkDjiboutiDominicaDominican RepublicEarly-demographic dividendEast Asia & PacificEast Asia & Pacific (excluding high income)East Asia & Pacific (IDA & IBRD countries)EcuadorEgypt, Arab Rep.El SalvadorEquatorial GuineaEritreaEstoniaEthiopiaEuro areaEurope & Central AsiaEurope & Central Asia (excluding high income)Europe & Central Asia (IDA & IBRD countries)European UnionFaroe IslandsFijiFinlandFragile and conflict affected situationsFranceFrench PolynesiaGabonGambia, TheGeorgiaGermanyGhanaGibraltarGreeceGreenlandGrenadaGuamGuatemalaGuineaGuinea-BissauGuyanaHaitiHeavily indebted poor countries (HIPC)High incomeHondurasHong Kong SAR, ChinaHungaryIBRD onlyIcelandIDA & IBRD totalIDA blendIDA onlyIDA totalIndiaIndonesiaIran, Islamic Rep.IraqIrelandIsraelItalyJamaicaJapanJordanKazakhstanKenyaKiribatiKorea, Dem. People’s Rep.Korea, Rep.KuwaitKyrgyz RepublicLao PDRLate-demographic dividendLatin America & Caribbean Latin America & Caribbean (excluding high income)Latin America & the Caribbean (IDA & IBRD countries)LatviaLeast developed countries: UN classificationLebanonLesothoLiberiaLibyaLithuaniaLow & middle incomeLow incomeLower middle incomeLuxembourgMacao SAR, ChinaMacedonia, FYRMadagascarMalawiMalaysiaMaldivesMaliMaltaMauritaniaMauritiusMexicoMiddle East & North AfricaMiddle East & North Africa (excluding high income)Middle East & North Africa (IDA & IBRD countries)Middle incomeMoldovaMongoliaMoroccoMozambiqueMyanmarNamibiaNauruNepalNetherlandsNew CaledoniaNew ZealandNicaraguaNigerNigeriaNorth AmericaNorwayOECD membersOmanOther small statesPacific island small statesPakistanPanamaPapua New GuineaParaguayPeruPhilippinesPolandPortugalPost-demographic dividendPre-demographic dividendPuerto RicoQatarRomaniaRussian FederationRwandaSamoaSao Tome and PrincipeSaudi ArabiaSenegalSeychellesSierra LeoneSingaporeSlovak RepublicSloveniaSmall statesSolomon IslandsSomaliaSouth AfricaSouth AsiaSouth Asia (IDA & IBRD)SpainSri LankaSt. Kitts and NevisSt. LuciaSt. Vincent and the GrenadinesSub-Saharan Africa Sub-Saharan Africa (excluding high income)Sub-Saharan Africa (IDA & IBRD countries)SudanSurinameSwazilandSwedenSwitzerlandSyrian Arab RepublicTajikistanTanzaniaThailandTimor-LesteTogoTongaTrinidad and TobagoTunisiaTurkeyTurkmenistanTurks and Caicos IslandsTuvaluUgandaUkraineUnited Arab EmiratesUnited KingdomUnited StatesUpper middle incomeUruguayUzbekistanVanuatuVenezuela, RBVietnamVirgin Islands (U.S.)WorldYemen, Rep.ZambiaZimbabwe Timeline:
This timeline shows a graph from 1971 to 2013 of Brazil. No data until 1970. Number of actual observations by date: 43.
Source name:
World Development Indicators
Source organization:
World Bank staff estimates from original source: European Commission, Joint Research Centre (JRC)/Netherlands Environmental Assessment Agency (PBL). Emission Database for Global Atmospheric Research (EDGAR): http://edgar.jrc.ec.europa.eu/.
Categories, topics:
Climate Change, Environment
Last updated:
apr 23, 2017
Indicators value changes by year
Minimum:
216.412K
jan 1, 2010
Maximum:
1.816 mln
jan 1, 2011
At the date of observation
Value
Absolute change
Change from previous value
jan 1, 1971
841.424K
+841.424K
0.0%
jan 1, 1972
593.686K
-247.738K
-29.44%
jan 1, 1973
718.77K
+125.083K
21.07%
jan 1, 1974
602.037K
-116.732K
-16.24%
jan 1, 1975
644.11K
+42.073K
6.99%
jan 1, 1976
726.487K
+82.377K
12.79%
jan 1, 1977
839.535K
+113.048K
15.56%
jan 1, 1978
650.528K
-189.007K
-22.51%
jan 1, 1979
783.911K
+133.383K
20.5%
jan 1, 1980
827.845K
+43.934K
5.6%
jan 1, 1981
881.626K
+53.781K
6.5%
jan 1, 1982
801.799K
-79.827K
-9.05%
jan 1, 1983
845.185K
+43.386K
5.41%
jan 1, 1984
862.925K
+17.74K
2.1%
jan 1, 1985
683.487K
-179.438K
-20.79%
jan 1, 1986
721.843K
+38.357K
5.61%
jan 1, 1987
766.162K
+44.319K
6.14%
jan 1, 1988
933.036K
+166.873K
21.78%
jan 1, 1989
786.255K
-146.78K
-15.73%
jan 1, 1990
794.581K
+8.326K
1.06%
jan 1, 1991
911.085K
+116.504K
14.66%
jan 1, 1992
861.737K
-49.348K
-5.42%
jan 1, 1993
912.692K
+50.955K
5.91%
jan 1, 1994
999.111K
+86.418K
9.47%
jan 1, 1995
710.195K
-288.916K
-28.92%
jan 1, 1996
779.817K
+69.623K
9.8%
jan 1, 1997
805.11K
+25.293K
3.24%
jan 1, 1998
812.539K
+7.429K
0.92%
jan 1, 1999
1.378 mln
+564.969K
69.53%
jan 1, 2000
727.021K
-650.487K
-47.22%
jan 1, 2001
365.399K
-361.622K
-49.74%
jan 1, 2002
377.553K
+12.154K
3.33%
jan 1, 2003
667.189K
+289.636K
76.71%
jan 1, 2004
660.534K
-6.655K
-1.0%
jan 1, 2005
924.432K
+263.898K
39.95%
jan 1, 2006
1.29 mln
+365.898K
39.58%
jan 1, 2007
653.288K
-637.042K
-49.37%
jan 1, 2008
1.71 mln
+1.057 mln
161.82%
jan 1, 2009
510.194K
-1.2 mln
-70.17%
jan 1, 2010
216.412K
-293.782K
-57.58%
jan 1, 2011
1.816 mln
+1.6 mln
739.2%
jan 1, 2012
1.816 mln
0.0
0.0%
jan 1, 2013
1.816 mln
0.0
0.0%
Ranking of countries by current statistics by years


Comments: