29
/
en
AIzaSyAYiBZKx7MnpbEhh9jyipgxe19OcubqV5w
April 1, 2024
96548
Burundi
BDI
true
2
1
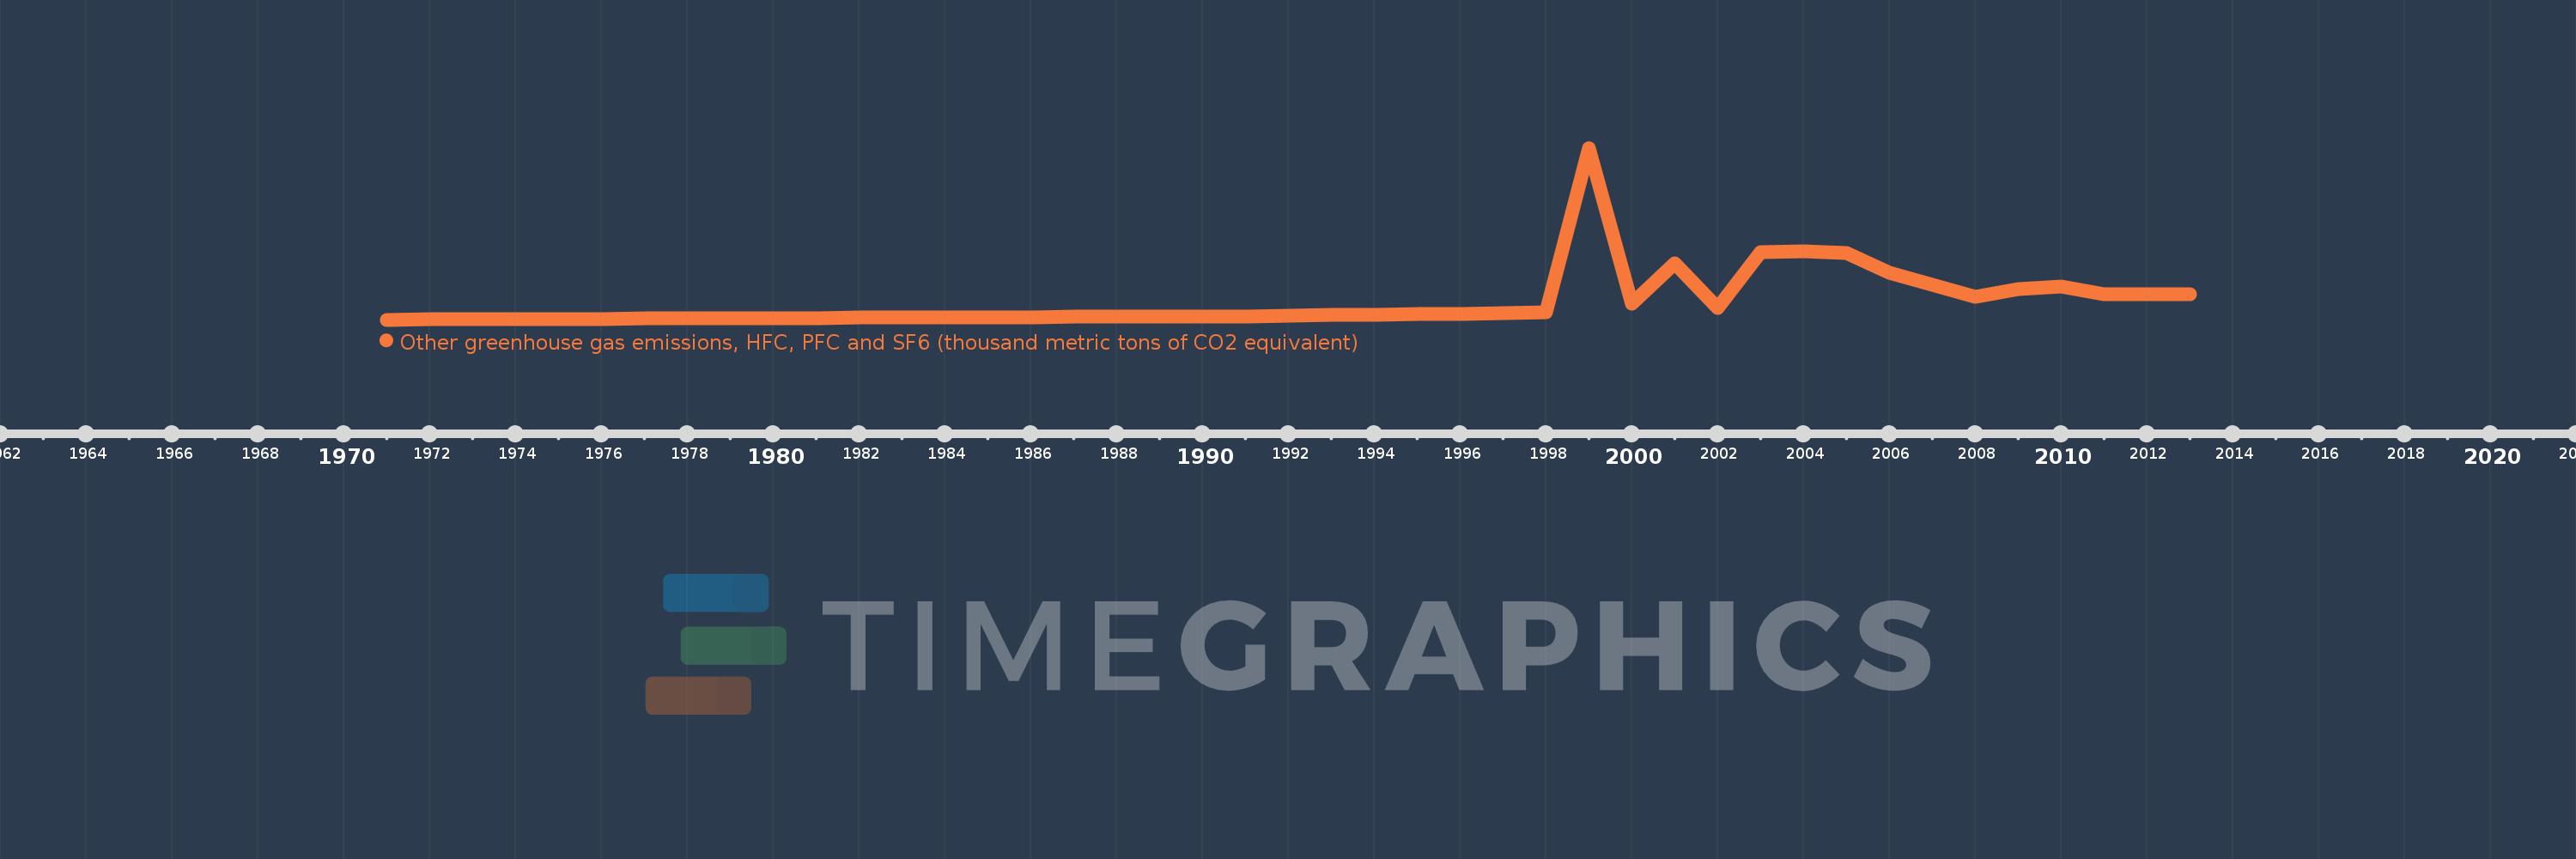
Other greenhouse gas emissions, HFC, PFC and SF6 (thousand metric tons of CO2 equivalent)
2013,2012,2011,2010,2009,2008,2007,2006,2005,2004,2003,2002,2001,2000,1999,1998,1997,1996,1995,1994,1993,1992,1991,1990,1989,1988,1987,1986,1985,1984,1983,1982,1981,1980,1979,1978,1977,1976,1975,1974,1973,1972,1971
This statistics in other country:
AfghanistanAlbaniaAlgeriaAmerican SamoaAngolaAntigua and BarbudaArab WorldArgentinaArmeniaArubaAustraliaAustriaAzerbaijanBahamas, TheBahrainBangladeshBarbadosBelarusBelgiumBelizeBeninBermudaBhutanBoliviaBosnia and HerzegovinaBotswanaBrazilBritish Virgin IslandsBrunei DarussalamBulgariaBurkina FasoBurundiCabo VerdeCambodiaCameroonCanadaCaribbean small statesCayman IslandsCentral African RepublicCentral Europe and the BalticsChadChileChinaColombiaComorosCongo, Dem. Rep.Congo, Rep.Costa RicaCote d'IvoireCroatiaCubaCyprusCzech RepublicDenmarkDjiboutiDominicaDominican RepublicEarly-demographic dividendEast Asia & PacificEast Asia & Pacific (excluding high income)East Asia & Pacific (IDA & IBRD countries)EcuadorEgypt, Arab Rep.El SalvadorEquatorial GuineaEritreaEstoniaEthiopiaEuro areaEurope & Central AsiaEurope & Central Asia (excluding high income)Europe & Central Asia (IDA & IBRD countries)European UnionFaroe IslandsFijiFinlandFragile and conflict affected situationsFranceFrench PolynesiaGabonGambia, TheGeorgiaGermanyGhanaGibraltarGreeceGreenlandGrenadaGuamGuatemalaGuineaGuinea-BissauGuyanaHaitiHeavily indebted poor countries (HIPC)High incomeHondurasHong Kong SAR, ChinaHungaryIBRD onlyIcelandIDA & IBRD totalIDA blendIDA onlyIDA totalIndiaIndonesiaIran, Islamic Rep.IraqIrelandIsraelItalyJamaicaJapanJordanKazakhstanKenyaKiribatiKorea, Dem. People’s Rep.Korea, Rep.KuwaitKyrgyz RepublicLao PDRLate-demographic dividendLatin America & Caribbean Latin America & Caribbean (excluding high income)Latin America & the Caribbean (IDA & IBRD countries)LatviaLeast developed countries: UN classificationLebanonLesothoLiberiaLibyaLithuaniaLow & middle incomeLow incomeLower middle incomeLuxembourgMacao SAR, ChinaMacedonia, FYRMadagascarMalawiMalaysiaMaldivesMaliMaltaMauritaniaMauritiusMexicoMiddle East & North AfricaMiddle East & North Africa (excluding high income)Middle East & North Africa (IDA & IBRD countries)Middle incomeMoldovaMongoliaMoroccoMozambiqueMyanmarNamibiaNauruNepalNetherlandsNew CaledoniaNew ZealandNicaraguaNigerNigeriaNorth AmericaNorwayOECD membersOmanOther small statesPacific island small statesPakistanPanamaPapua New GuineaParaguayPeruPhilippinesPolandPortugalPost-demographic dividendPre-demographic dividendPuerto RicoQatarRomaniaRussian FederationRwandaSamoaSao Tome and PrincipeSaudi ArabiaSenegalSeychellesSierra LeoneSingaporeSlovak RepublicSloveniaSmall statesSolomon IslandsSomaliaSouth AfricaSouth AsiaSouth Asia (IDA & IBRD)SpainSri LankaSt. Kitts and NevisSt. LuciaSt. Vincent and the GrenadinesSub-Saharan Africa Sub-Saharan Africa (excluding high income)Sub-Saharan Africa (IDA & IBRD countries)SudanSurinameSwazilandSwedenSwitzerlandSyrian Arab RepublicTajikistanTanzaniaThailandTimor-LesteTogoTongaTrinidad and TobagoTunisiaTurkeyTurkmenistanTurks and Caicos IslandsTuvaluUgandaUkraineUnited Arab EmiratesUnited KingdomUnited StatesUpper middle incomeUruguayUzbekistanVanuatuVenezuela, RBVietnamVirgin Islands (U.S.)WorldYemen, Rep.ZambiaZimbabwe Timeline:
This timeline shows a graph from 1971 to 2013 of Burundi. No data until 1970. Number of actual observations by date: 43.
Source name:
World Development Indicators
Source organization:
World Bank staff estimates from original source: European Commission, Joint Research Centre (JRC)/Netherlands Environmental Assessment Agency (PBL). Emission Database for Global Atmospheric Research (EDGAR): http://edgar.jrc.ec.europa.eu/.
Categories, topics:
Climate Change, Environment
Last updated:
apr 23, 2017
Indicators value changes by year
At the date of observation
Value
Absolute change
Change from previous value
jan 1, 1972
3.315
+3.315
-1457.95 trl%
jan 1, 1973
6.63
+3.315
100.0%
jan 1, 1974
9.945
+3.315
50.0%
jan 1, 1975
13.26
+3.315
33.33%
jan 1, 1976
16.575
+3.315
25.0%
jan 1, 1977
19.89
+3.315
20.0%
jan 1, 1978
23.205
+3.315
16.67%
jan 1, 1979
26.52
+3.315
14.29%
jan 1, 1980
29.835
+3.315
12.5%
jan 1, 1981
33.15
+3.315
11.11%
jan 1, 1982
36.465
+3.315
10.0%
jan 1, 1983
39.78
+3.315
9.09%
jan 1, 1984
43.095
+3.315
8.33%
jan 1, 1985
46.41
+3.315
7.69%
jan 1, 1986
49.725
+3.315
7.14%
jan 1, 1987
53.04
+3.315
6.67%
jan 1, 1988
56.355
+3.315
6.25%
jan 1, 1989
59.67
+3.315
5.88%
jan 1, 1990
62.985
+3.315
5.56%
jan 1, 1991
66.3
+3.315
5.26%
jan 1, 1992
76.376
+10.076
15.2%
jan 1, 1993
86.479
+10.103
13.23%
jan 1, 1994
96.611
+10.132
11.72%
jan 1, 1995
106.772
+10.161
10.52%
jan 1, 1996
116.961
+10.189
9.54%
jan 1, 1997
127.178
+10.217
8.74%
jan 1, 1998
137.424
+10.246
8.06%
jan 1, 1999
3.25K
+3.112K
2.26K%
jan 1, 2000
302.751
-2.947K
-90.68%
jan 1, 2001
1.065K
+761.809
251.63%
jan 1, 2002
216.107
-848.453
-79.7%
jan 1, 2003
1.279K
+1.062K
491.61%
jan 1, 2004
1.29K
+11.12
0.87%
jan 1, 2005
1.258K
-31.98
-2.48%
jan 1, 2006
890.246
-367.404
-29.21%
jan 1, 2007
667.228
-223.018
-25.05%
jan 1, 2008
433.78
-233.448
-34.99%
jan 1, 2009
581.749
+147.969
34.11%
jan 1, 2010
623.541
+41.792
7.18%
jan 1, 2011
488.0
-135.541
-21.74%
jan 1, 2012
488.0
+0.0
0.0%
jan 1, 2013
488.0
0.0
0.0%
Ranking of countries by current statistics by years


Comments: