29
/
en
AIzaSyAYiBZKx7MnpbEhh9jyipgxe19OcubqV5w
April 1, 2024
269790
Turkey
TUR
true
2
1
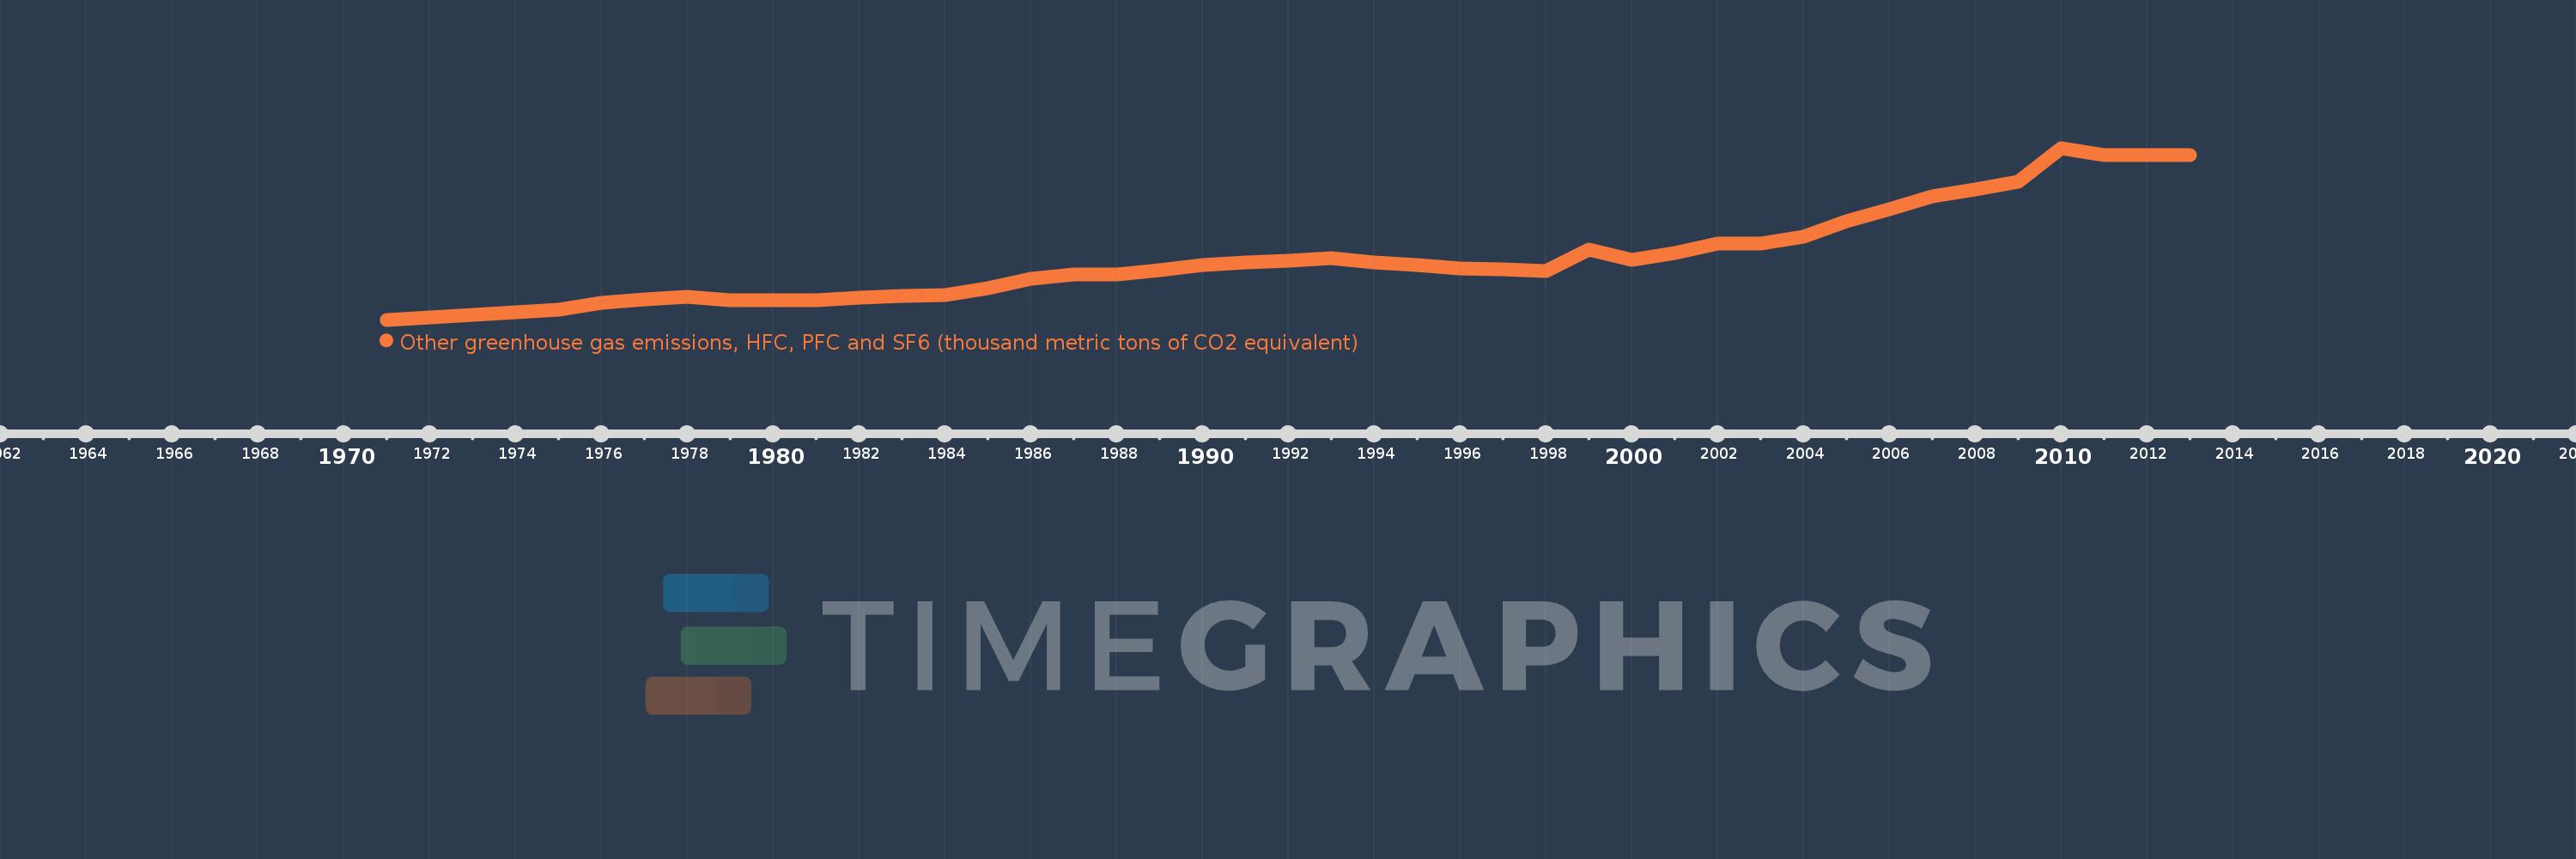
Other greenhouse gas emissions, HFC, PFC and SF6 (thousand metric tons of CO2 equivalent)
2013,2012,2011,2010,2009,2008,2007,2006,2005,2004,2003,2002,2001,2000,1999,1998,1997,1996,1995,1994,1993,1992,1991,1990,1989,1988,1987,1986,1985,1984,1983,1982,1981,1980,1979,1978,1977,1976,1975,1974,1973,1972,1971
This statistics in other country:
AfghanistanAlbaniaAlgeriaAmerican SamoaAngolaAntigua and BarbudaArab WorldArgentinaArmeniaArubaAustraliaAustriaAzerbaijanBahamas, TheBahrainBangladeshBarbadosBelarusBelgiumBelizeBeninBermudaBhutanBoliviaBosnia and HerzegovinaBotswanaBrazilBritish Virgin IslandsBrunei DarussalamBulgariaBurkina FasoBurundiCabo VerdeCambodiaCameroonCanadaCaribbean small statesCayman IslandsCentral African RepublicCentral Europe and the BalticsChadChileChinaColombiaComorosCongo, Dem. Rep.Congo, Rep.Costa RicaCote d'IvoireCroatiaCubaCyprusCzech RepublicDenmarkDjiboutiDominicaDominican RepublicEarly-demographic dividendEast Asia & PacificEast Asia & Pacific (excluding high income)East Asia & Pacific (IDA & IBRD countries)EcuadorEgypt, Arab Rep.El SalvadorEquatorial GuineaEritreaEstoniaEthiopiaEuro areaEurope & Central AsiaEurope & Central Asia (excluding high income)Europe & Central Asia (IDA & IBRD countries)European UnionFaroe IslandsFijiFinlandFragile and conflict affected situationsFranceFrench PolynesiaGabonGambia, TheGeorgiaGermanyGhanaGibraltarGreeceGreenlandGrenadaGuamGuatemalaGuineaGuinea-BissauGuyanaHaitiHeavily indebted poor countries (HIPC)High incomeHondurasHong Kong SAR, ChinaHungaryIBRD onlyIcelandIDA & IBRD totalIDA blendIDA onlyIDA totalIndiaIndonesiaIran, Islamic Rep.IraqIrelandIsraelItalyJamaicaJapanJordanKazakhstanKenyaKiribatiKorea, Dem. People’s Rep.Korea, Rep.KuwaitKyrgyz RepublicLao PDRLate-demographic dividendLatin America & Caribbean Latin America & Caribbean (excluding high income)Latin America & the Caribbean (IDA & IBRD countries)LatviaLeast developed countries: UN classificationLebanonLesothoLiberiaLibyaLithuaniaLow & middle incomeLow incomeLower middle incomeLuxembourgMacao SAR, ChinaMacedonia, FYRMadagascarMalawiMalaysiaMaldivesMaliMaltaMauritaniaMauritiusMexicoMiddle East & North AfricaMiddle East & North Africa (excluding high income)Middle East & North Africa (IDA & IBRD countries)Middle incomeMoldovaMongoliaMoroccoMozambiqueMyanmarNamibiaNauruNepalNetherlandsNew CaledoniaNew ZealandNicaraguaNigerNigeriaNorth AmericaNorwayOECD membersOmanOther small statesPacific island small statesPakistanPanamaPapua New GuineaParaguayPeruPhilippinesPolandPortugalPost-demographic dividendPre-demographic dividendPuerto RicoQatarRomaniaRussian FederationRwandaSamoaSao Tome and PrincipeSaudi ArabiaSenegalSeychellesSierra LeoneSingaporeSlovak RepublicSloveniaSmall statesSolomon IslandsSomaliaSouth AfricaSouth AsiaSouth Asia (IDA & IBRD)SpainSri LankaSt. Kitts and NevisSt. LuciaSt. Vincent and the GrenadinesSub-Saharan Africa Sub-Saharan Africa (excluding high income)Sub-Saharan Africa (IDA & IBRD countries)SudanSurinameSwazilandSwedenSwitzerlandSyrian Arab RepublicTajikistanTanzaniaThailandTimor-LesteTogoTongaTrinidad and TobagoTunisiaTurkeyTurkmenistanTurks and Caicos IslandsTuvaluUgandaUkraineUnited Arab EmiratesUnited KingdomUnited StatesUpper middle incomeUruguayUzbekistanVanuatuVenezuela, RBVietnamVirgin Islands (U.S.)WorldYemen, Rep.ZambiaZimbabwe Timeline:
This timeline shows a graph from 1971 to 2013 of Turkey. No data until 1970. Number of actual observations by date: 43.
Source name:
World Development Indicators
Source organization:
World Bank staff estimates from original source: European Commission, Joint Research Centre (JRC)/Netherlands Environmental Assessment Agency (PBL). Emission Database for Global Atmospheric Research (EDGAR): http://edgar.jrc.ec.europa.eu/.
Categories, topics:
Climate Change, Environment
Last updated:
apr 23, 2017
Indicators value changes by year
Maximum:
8.696K
jan 1, 2010
At the date of observation
Value
Absolute change
Change from previous value
jan 1, 1971
4.35
+4.35
0.0%
jan 1, 1972
136.266
+131.916
3.03K%
jan 1, 1973
242.532
+106.266
77.98%
jan 1, 1974
385.798
+143.266
59.07%
jan 1, 1975
506.3
+120.502
31.23%
jan 1, 1976
881.125
+374.825
74.03%
jan 1, 1977
1.051K
+170.225
19.32%
jan 1, 1978
1.181K
+129.225
12.29%
jan 1, 1979
994.8
-185.775
-15.74%
jan 1, 1980
1.003K
+8.225
0.83%
jan 1, 1981
985.25
-17.775
-1.77%
jan 1, 1982
1.119K
+134.225
13.62%
jan 1, 1983
1.193K
+73.225
6.54%
jan 1, 1984
1.249K
+56.225
4.71%
jan 1, 1985
1.612K
+363.225
29.08%
jan 1, 1986
2.085K
+473.225
29.35%
jan 1, 1987
2.296K
+210.225
10.08%
jan 1, 1988
2.296K
+0.225
0.01%
jan 1, 1989
2.498K
+202.225
8.81%
jan 1, 1990
2.778K
+280.225
11.22%
jan 1, 1991
2.901K
+122.274
4.4%
jan 1, 1992
2.993K
+92.416
3.19%
jan 1, 1993
3.101K
+107.828
3.6%
jan 1, 1994
2.908K
-192.66
-6.21%
jan 1, 1995
2.762K
-145.76
-5.01%
jan 1, 1996
2.598K
-164.571
-5.96%
jan 1, 1997
2.546K
-51.32
-1.98%
jan 1, 1998
2.472K
-74.717
-2.93%
jan 1, 1999
3.553K
+1.081K
43.75%
jan 1, 2000
3.029K
-523.866
-14.74%
jan 1, 2001
3.369K
+339.887
11.22%
jan 1, 2002
3.858K
+488.939
14.51%
jan 1, 2003
3.866K
+7.88
0.2%
jan 1, 2004
4.196K
+329.9
8.53%
jan 1, 2005
5.007K
+810.744
19.32%
jan 1, 2006
5.593K
+586.146
11.71%
jan 1, 2007
6.238K
+644.721
11.53%
jan 1, 2008
6.594K
+356.732
5.72%
jan 1, 2009
6.981K
+386.311
5.86%
jan 1, 2010
8.696K
+1.715K
24.57%
jan 1, 2011
8.335K
-360.65
-4.15%
jan 1, 2012
8.335K
+0.0
0.0%
jan 1, 2013
8.335K
0.0
0.0%
Ranking of countries by current statistics by years


Comments: