29
/
en
AIzaSyAYiBZKx7MnpbEhh9jyipgxe19OcubqV5w
April 1, 2024
246048
South Africa
ZAF
true
2
1
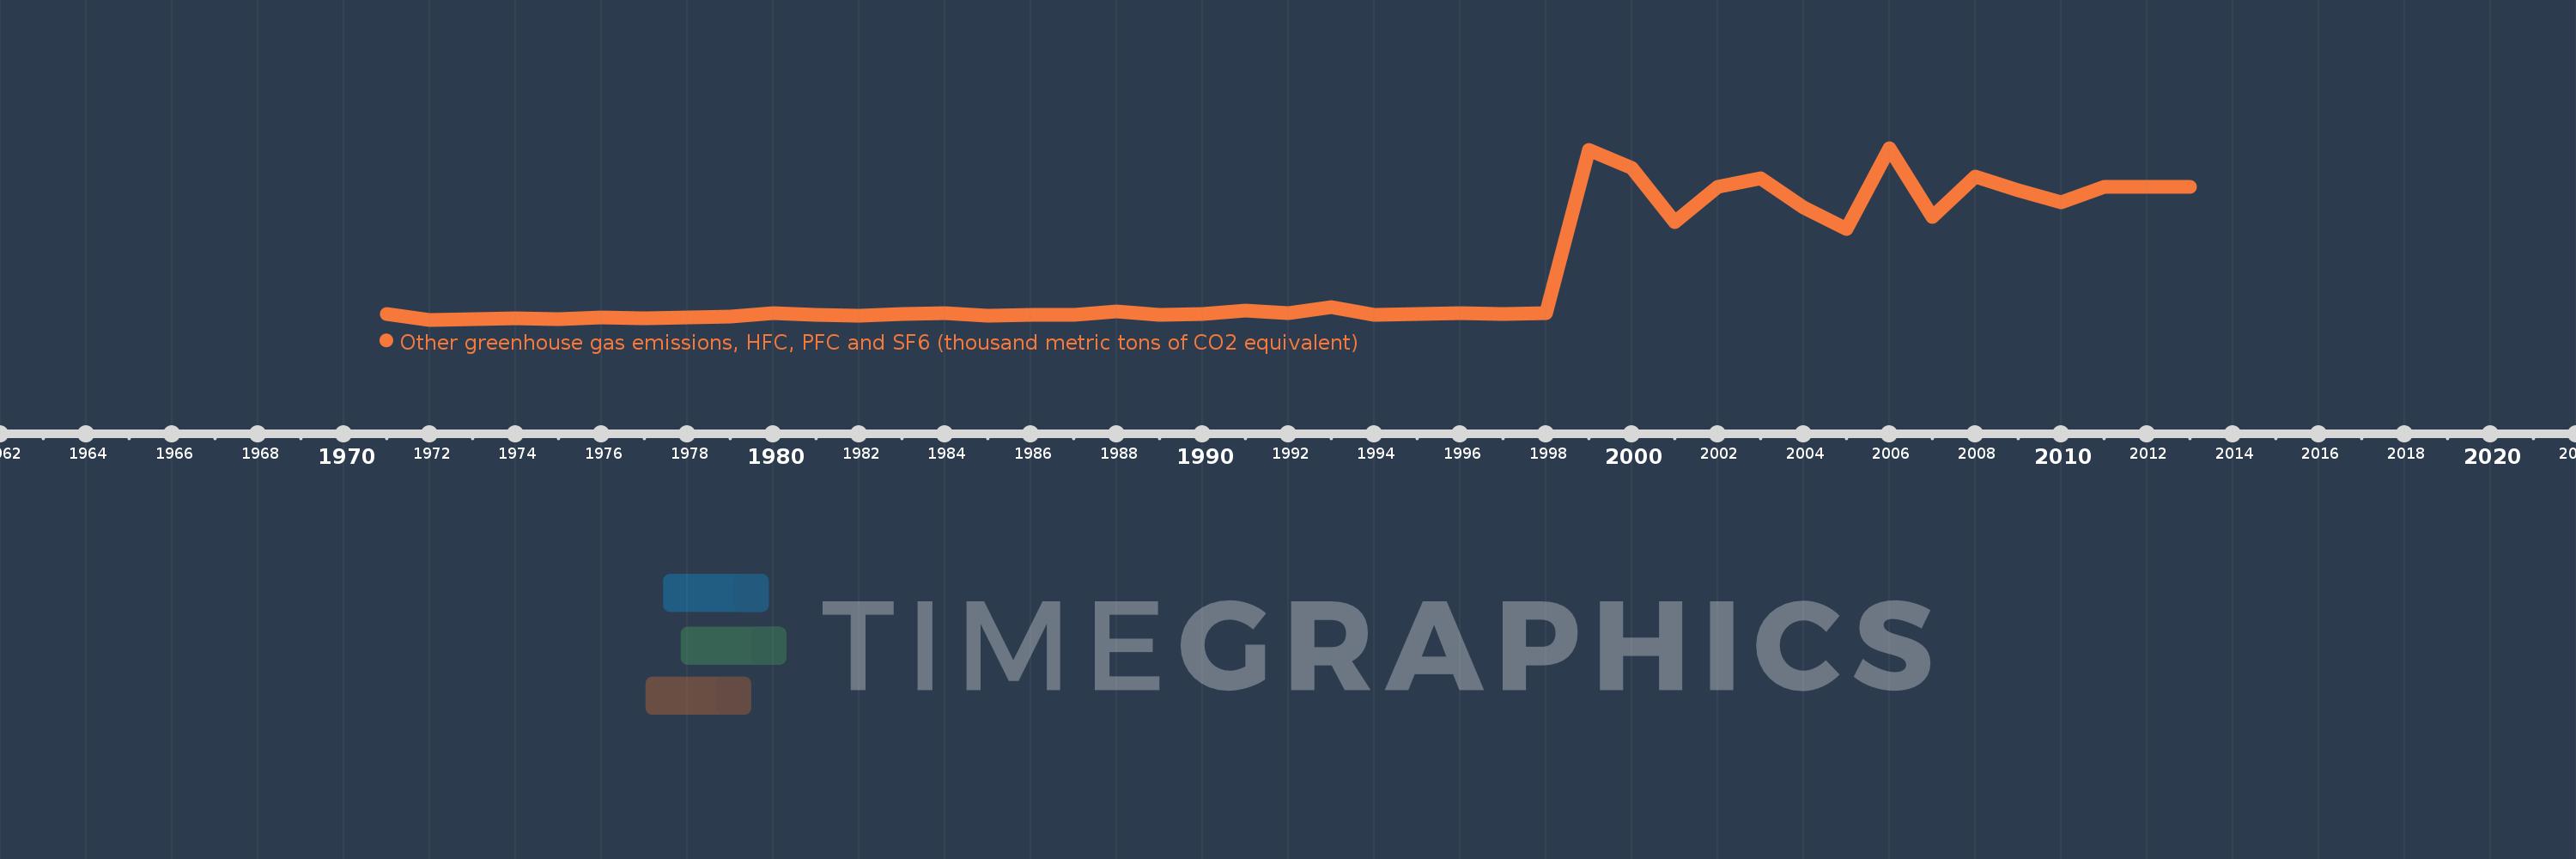
Other greenhouse gas emissions, HFC, PFC and SF6 (thousand metric tons of CO2 equivalent)
2013,2012,2011,2010,2009,2008,2007,2006,2005,2004,2003,2002,2001,2000,1999,1998,1997,1996,1995,1994,1993,1992,1991,1990,1989,1988,1987,1986,1985,1984,1983,1982,1981,1980,1979,1978,1977,1976,1975,1974,1973,1972,1971
This statistics in other country:
AfghanistanAlbaniaAlgeriaAmerican SamoaAngolaAntigua and BarbudaArab WorldArgentinaArmeniaArubaAustraliaAustriaAzerbaijanBahamas, TheBahrainBangladeshBarbadosBelarusBelgiumBelizeBeninBermudaBhutanBoliviaBosnia and HerzegovinaBotswanaBrazilBritish Virgin IslandsBrunei DarussalamBulgariaBurkina FasoBurundiCabo VerdeCambodiaCameroonCanadaCaribbean small statesCayman IslandsCentral African RepublicCentral Europe and the BalticsChadChileChinaColombiaComorosCongo, Dem. Rep.Congo, Rep.Costa RicaCote d'IvoireCroatiaCubaCyprusCzech RepublicDenmarkDjiboutiDominicaDominican RepublicEarly-demographic dividendEast Asia & PacificEast Asia & Pacific (excluding high income)East Asia & Pacific (IDA & IBRD countries)EcuadorEgypt, Arab Rep.El SalvadorEquatorial GuineaEritreaEstoniaEthiopiaEuro areaEurope & Central AsiaEurope & Central Asia (excluding high income)Europe & Central Asia (IDA & IBRD countries)European UnionFaroe IslandsFijiFinlandFragile and conflict affected situationsFranceFrench PolynesiaGabonGambia, TheGeorgiaGermanyGhanaGibraltarGreeceGreenlandGrenadaGuamGuatemalaGuineaGuinea-BissauGuyanaHaitiHeavily indebted poor countries (HIPC)High incomeHondurasHong Kong SAR, ChinaHungaryIBRD onlyIcelandIDA & IBRD totalIDA blendIDA onlyIDA totalIndiaIndonesiaIran, Islamic Rep.IraqIrelandIsraelItalyJamaicaJapanJordanKazakhstanKenyaKiribatiKorea, Dem. People’s Rep.Korea, Rep.KuwaitKyrgyz RepublicLao PDRLate-demographic dividendLatin America & Caribbean Latin America & Caribbean (excluding high income)Latin America & the Caribbean (IDA & IBRD countries)LatviaLeast developed countries: UN classificationLebanonLesothoLiberiaLibyaLithuaniaLow & middle incomeLow incomeLower middle incomeLuxembourgMacao SAR, ChinaMacedonia, FYRMadagascarMalawiMalaysiaMaldivesMaliMaltaMauritaniaMauritiusMexicoMiddle East & North AfricaMiddle East & North Africa (excluding high income)Middle East & North Africa (IDA & IBRD countries)Middle incomeMoldovaMongoliaMoroccoMozambiqueMyanmarNamibiaNauruNepalNetherlandsNew CaledoniaNew ZealandNicaraguaNigerNigeriaNorth AmericaNorwayOECD membersOmanOther small statesPacific island small statesPakistanPanamaPapua New GuineaParaguayPeruPhilippinesPolandPortugalPost-demographic dividendPre-demographic dividendPuerto RicoQatarRomaniaRussian FederationRwandaSamoaSao Tome and PrincipeSaudi ArabiaSenegalSeychellesSierra LeoneSingaporeSlovak RepublicSloveniaSmall statesSolomon IslandsSomaliaSouth AfricaSouth AsiaSouth Asia (IDA & IBRD)SpainSri LankaSt. Kitts and NevisSt. LuciaSt. Vincent and the GrenadinesSub-Saharan Africa Sub-Saharan Africa (excluding high income)Sub-Saharan Africa (IDA & IBRD countries)SudanSurinameSwazilandSwedenSwitzerlandSyrian Arab RepublicTajikistanTanzaniaThailandTimor-LesteTogoTongaTrinidad and TobagoTunisiaTurkeyTurkmenistanTurks and Caicos IslandsTuvaluUgandaUkraineUnited Arab EmiratesUnited KingdomUnited StatesUpper middle incomeUruguayUzbekistanVanuatuVenezuela, RBVietnamVirgin Islands (U.S.)WorldYemen, Rep.ZambiaZimbabwe Timeline:
This timeline shows a graph from 1971 to 2013 of South Africa. No data until 1970. Number of actual observations by date: 43.
Source name:
World Development Indicators
Source organization:
World Bank staff estimates from original source: European Commission, Joint Research Centre (JRC)/Netherlands Environmental Assessment Agency (PBL). Emission Database for Global Atmospheric Research (EDGAR): http://edgar.jrc.ec.europa.eu/.
Categories, topics:
Climate Change, Environment
Last updated:
apr 23, 2017
Indicators value changes by year
Minimum:
1.261K
jan 1, 1972
Maximum:
49.49K
jan 1, 2006
At the date of observation
Value
Absolute change
Change from previous value
jan 1, 1971
2.797K
+2.797K
0.0%
jan 1, 1972
1.261K
-1.536K
-54.93%
jan 1, 1973
1.507K
+246.47
19.55%
jan 1, 1974
1.673K
+165.92
11.01%
jan 1, 1975
1.419K
-254.29
-15.2%
jan 1, 1976
1.851K
+432.06
30.45%
jan 1, 1977
1.609K
-241.84
-13.07%
jan 1, 1978
1.983K
+374.29
23.26%
jan 1, 1979
2.166K
+182.6
9.21%
jan 1, 1980
3.117K
+951.01
43.91%
jan 1, 1981
2.519K
-597.89
-19.18%
jan 1, 1982
2.447K
-72.2
-2.87%
jan 1, 1983
2.921K
+474.28
19.38%
jan 1, 1984
3.09K
+169.12
5.79%
jan 1, 1985
2.511K
-579.16
-18.74%
jan 1, 1986
2.626K
+114.33
4.55%
jan 1, 1987
2.587K
-38.074
-1.45%
jan 1, 1988
3.484K
+896.104
34.63%
jan 1, 1989
2.552K
-931.977
-26.75%
jan 1, 1990
2.847K
+295.167
11.57%
jan 1, 1991
3.871K
+1.025K
35.99%
jan 1, 1992
3.029K
-841.968
-21.75%
jan 1, 1993
4.706K
+1.677K
55.34%
jan 1, 1994
2.592K
-2.114K
-44.93%
jan 1, 1995
2.993K
+401.555
15.49%
jan 1, 1996
3.09K
+96.364
3.22%
jan 1, 1997
2.975K
-114.595
-3.71%
jan 1, 1998
3.037K
+61.824
2.08%
jan 1, 1999
49.048K
+46.011K
1.52K%
jan 1, 2000
43.797K
-5.25K
-10.7%
jan 1, 2001
28.786K
-15.011K
-34.27%
jan 1, 2002
38.459K
+9.673K
33.6%
jan 1, 2003
41.074K
+2.614K
6.8%
jan 1, 2004
32.815K
-8.259K
-20.11%
jan 1, 2005
26.723K
-6.092K
-18.56%
jan 1, 2006
49.49K
+22.767K
85.19%
jan 1, 2007
30.109K
-19.381K
-39.16%
jan 1, 2008
41.4K
+11.291K
37.5%
jan 1, 2009
37.638K
-3.762K
-9.09%
jan 1, 2010
34.179K
-3.459K
-9.19%
jan 1, 2011
38.505K
+4.326K
12.66%
jan 1, 2012
38.505K
0.0
0.0%
jan 1, 2013
38.505K
0.0
0.0%
Ranking of countries by current statistics by years


Comments: