29
/
en
AIzaSyAYiBZKx7MnpbEhh9jyipgxe19OcubqV5w
April 1, 2024
172057
Kuwait
KWT
true
2
1
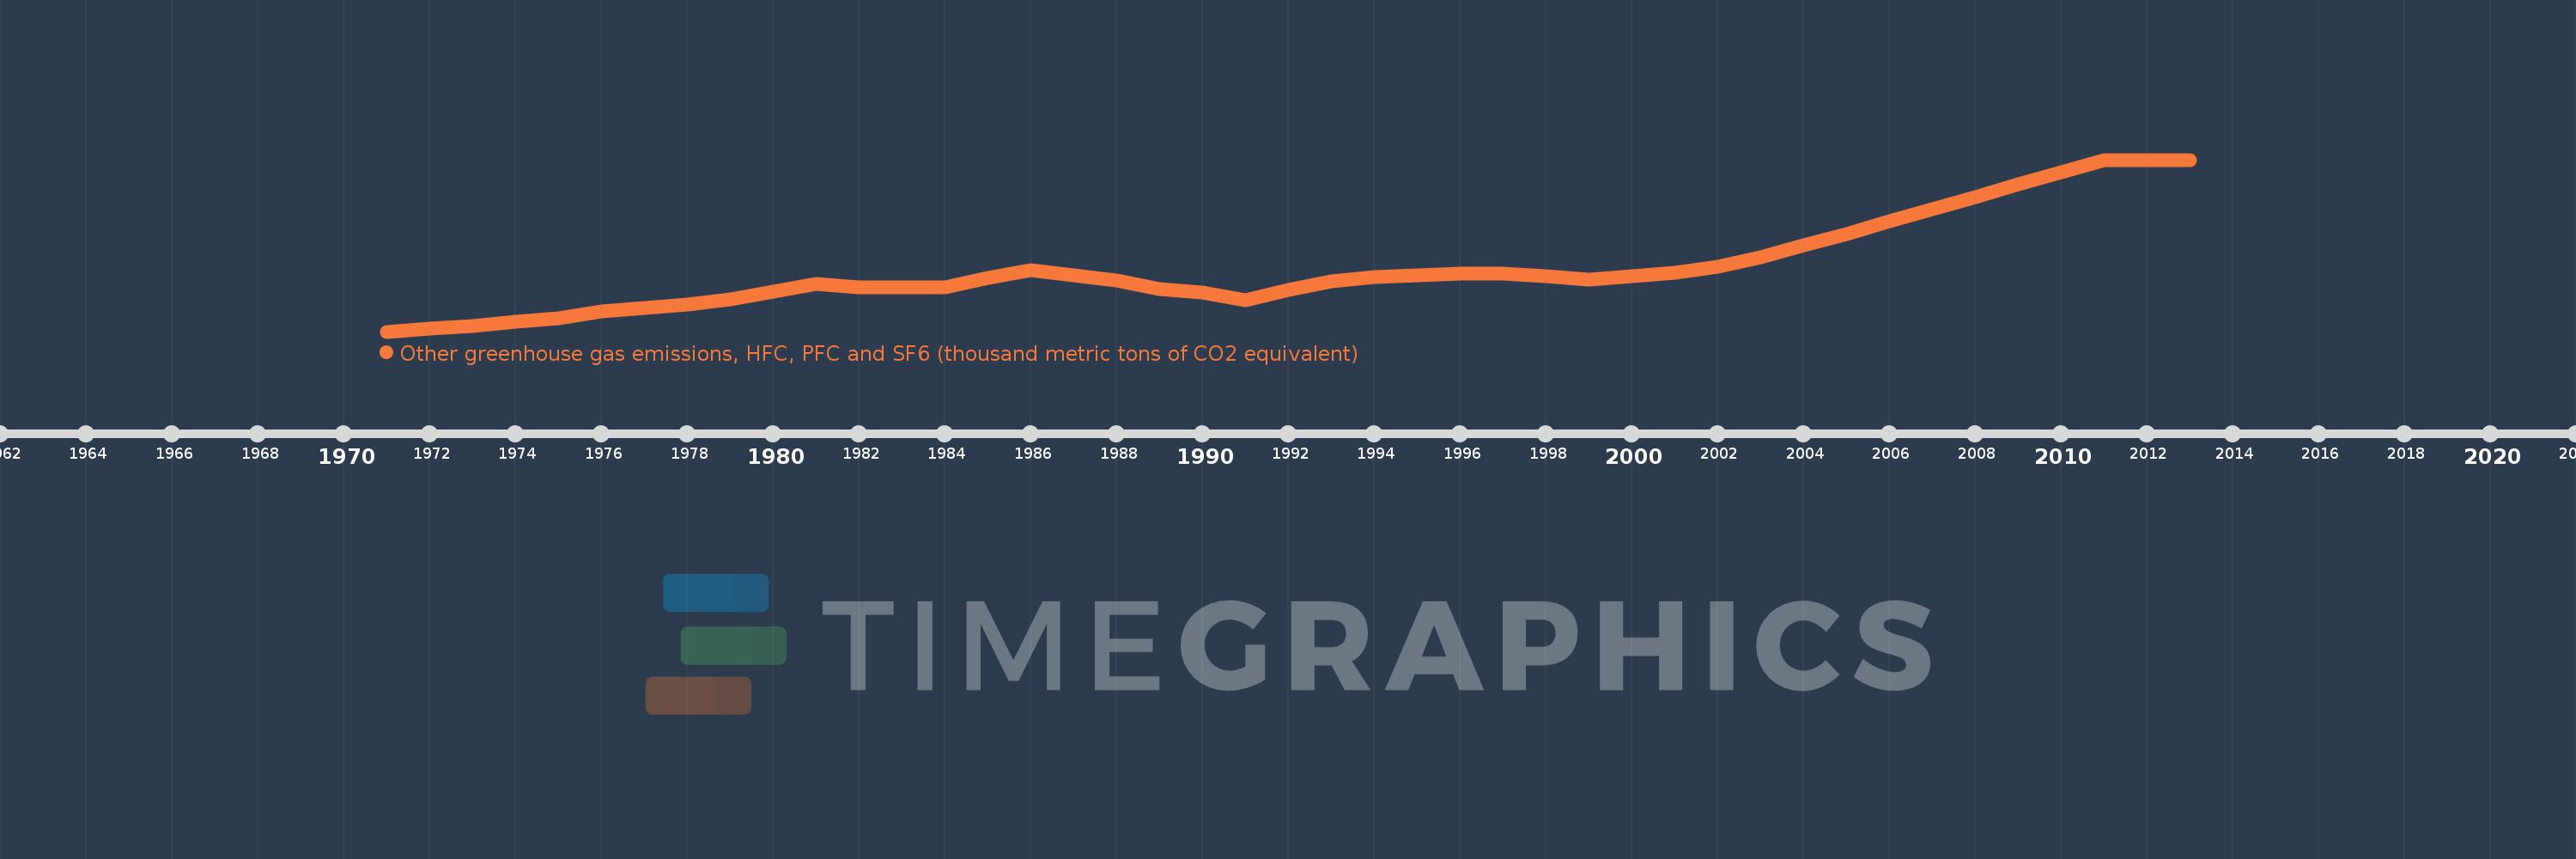
Other greenhouse gas emissions, HFC, PFC and SF6 (thousand metric tons of CO2 equivalent)
2013,2012,2011,2010,2009,2008,2007,2006,2005,2004,2003,2002,2001,2000,1999,1998,1997,1996,1995,1994,1993,1992,1991,1990,1989,1988,1987,1986,1985,1984,1983,1982,1981,1980,1979,1978,1977,1976,1975,1974,1973,1972,1971
This statistics in other country:
AfghanistanAlbaniaAlgeriaAmerican SamoaAngolaAntigua and BarbudaArab WorldArgentinaArmeniaArubaAustraliaAustriaAzerbaijanBahamas, TheBahrainBangladeshBarbadosBelarusBelgiumBelizeBeninBermudaBhutanBoliviaBosnia and HerzegovinaBotswanaBrazilBritish Virgin IslandsBrunei DarussalamBulgariaBurkina FasoBurundiCabo VerdeCambodiaCameroonCanadaCaribbean small statesCayman IslandsCentral African RepublicCentral Europe and the BalticsChadChileChinaColombiaComorosCongo, Dem. Rep.Congo, Rep.Costa RicaCote d'IvoireCroatiaCubaCyprusCzech RepublicDenmarkDjiboutiDominicaDominican RepublicEarly-demographic dividendEast Asia & PacificEast Asia & Pacific (excluding high income)East Asia & Pacific (IDA & IBRD countries)EcuadorEgypt, Arab Rep.El SalvadorEquatorial GuineaEritreaEstoniaEthiopiaEuro areaEurope & Central AsiaEurope & Central Asia (excluding high income)Europe & Central Asia (IDA & IBRD countries)European UnionFaroe IslandsFijiFinlandFragile and conflict affected situationsFranceFrench PolynesiaGabonGambia, TheGeorgiaGermanyGhanaGibraltarGreeceGreenlandGrenadaGuamGuatemalaGuineaGuinea-BissauGuyanaHaitiHeavily indebted poor countries (HIPC)High incomeHondurasHong Kong SAR, ChinaHungaryIBRD onlyIcelandIDA & IBRD totalIDA blendIDA onlyIDA totalIndiaIndonesiaIran, Islamic Rep.IraqIrelandIsraelItalyJamaicaJapanJordanKazakhstanKenyaKiribatiKorea, Dem. People’s Rep.Korea, Rep.KuwaitKyrgyz RepublicLao PDRLate-demographic dividendLatin America & Caribbean Latin America & Caribbean (excluding high income)Latin America & the Caribbean (IDA & IBRD countries)LatviaLeast developed countries: UN classificationLebanonLesothoLiberiaLibyaLithuaniaLow & middle incomeLow incomeLower middle incomeLuxembourgMacao SAR, ChinaMacedonia, FYRMadagascarMalawiMalaysiaMaldivesMaliMaltaMauritaniaMauritiusMexicoMiddle East & North AfricaMiddle East & North Africa (excluding high income)Middle East & North Africa (IDA & IBRD countries)Middle incomeMoldovaMongoliaMoroccoMozambiqueMyanmarNamibiaNauruNepalNetherlandsNew CaledoniaNew ZealandNicaraguaNigerNigeriaNorth AmericaNorwayOECD membersOmanOther small statesPacific island small statesPakistanPanamaPapua New GuineaParaguayPeruPhilippinesPolandPortugalPost-demographic dividendPre-demographic dividendPuerto RicoQatarRomaniaRussian FederationRwandaSamoaSao Tome and PrincipeSaudi ArabiaSenegalSeychellesSierra LeoneSingaporeSlovak RepublicSloveniaSmall statesSolomon IslandsSomaliaSouth AfricaSouth AsiaSouth Asia (IDA & IBRD)SpainSri LankaSt. Kitts and NevisSt. LuciaSt. Vincent and the GrenadinesSub-Saharan Africa Sub-Saharan Africa (excluding high income)Sub-Saharan Africa (IDA & IBRD countries)SudanSurinameSwazilandSwedenSwitzerlandSyrian Arab RepublicTajikistanTanzaniaThailandTimor-LesteTogoTongaTrinidad and TobagoTunisiaTurkeyTurkmenistanTurks and Caicos IslandsTuvaluUgandaUkraineUnited Arab EmiratesUnited KingdomUnited StatesUpper middle incomeUruguayUzbekistanVanuatuVenezuela, RBVietnamVirgin Islands (U.S.)WorldYemen, Rep.ZambiaZimbabwe Timeline:
This timeline shows a graph from 1971 to 2013 of Kuwait. No data until 1970. Number of actual observations by date: 43.
Source name:
World Development Indicators
Source organization:
World Bank staff estimates from original source: European Commission, Joint Research Centre (JRC)/Netherlands Environmental Assessment Agency (PBL). Emission Database for Global Atmospheric Research (EDGAR): http://edgar.jrc.ec.europa.eu/.
Categories, topics:
Climate Change, Environment
Last updated:
apr 23, 2017
Indicators value changes by year
Maximum:
1.451K
jan 1, 2012
At the date of observation
Value
Absolute change
Change from previous value
jan 1, 1972
26.2
+26.2
11522.88 trl%
jan 1, 1973
48.8
+22.6
86.26%
jan 1, 1974
82.9
+34.1
69.88%
jan 1, 1975
110.0
+27.1
32.69%
jan 1, 1976
174.0
+64.0
58.18%
jan 1, 1977
198.0
+24.0
13.79%
jan 1, 1978
232.0
+34.0
17.17%
jan 1, 1979
269.0
+37.0
15.95%
jan 1, 1980
336.0
+67.0
24.91%
jan 1, 1981
402.0
+66.0
19.64%
jan 1, 1982
376.0
-26.0
-6.47%
jan 1, 1983
376.0
+0.0
0.0%
jan 1, 1984
373.0
-3.0
-0.8%
jan 1, 1985
451.0
+78.0
20.91%
jan 1, 1986
516.0
+65.0
14.41%
jan 1, 1987
476.0
-40.0
-7.75%
jan 1, 1988
433.0
-43.0
-9.03%
jan 1, 1989
362.0
-71.0
-16.4%
jan 1, 1990
331.0
-31.0
-8.56%
jan 1, 1991
263.147
-67.853
-20.5%
jan 1, 1992
350.778
+87.631
33.3%
jan 1, 1993
427.11
+76.332
21.76%
jan 1, 1994
457.55
+30.44
7.13%
jan 1, 1995
478.6
+21.05
4.6%
jan 1, 1996
488.3
+9.7
2.03%
jan 1, 1997
492.3
+4.0
0.82%
jan 1, 1998
467.0
-25.3
-5.14%
jan 1, 1999
442.5
-24.5
-5.25%
jan 1, 2000
467.0
+24.5
5.54%
jan 1, 2001
498.0
+31.0
6.64%
jan 1, 2002
551.0
+53.0
10.64%
jan 1, 2003
624.0
+73.0
13.25%
jan 1, 2004
726.0
+102.0
16.35%
jan 1, 2005
827.0
+101.0
13.91%
jan 1, 2006
930.0
+103.0
12.45%
jan 1, 2007
1.031K
+101.0
10.86%
jan 1, 2008
1.137K
+106.0
10.28%
jan 1, 2009
1.242K
+105.0
9.23%
jan 1, 2010
1.347K
+105.0
8.45%
jan 1, 2011
1.451K
+104.0
7.72%
jan 1, 2012
1.451K
+0.0
0.0%
jan 1, 2013
1.451K
0.0
0.0%
Ranking of countries by current statistics by years


Comments: