29
/
en
AIzaSyAYiBZKx7MnpbEhh9jyipgxe19OcubqV5w
April 1, 2024
278089
Uruguay
URY
true
2
1
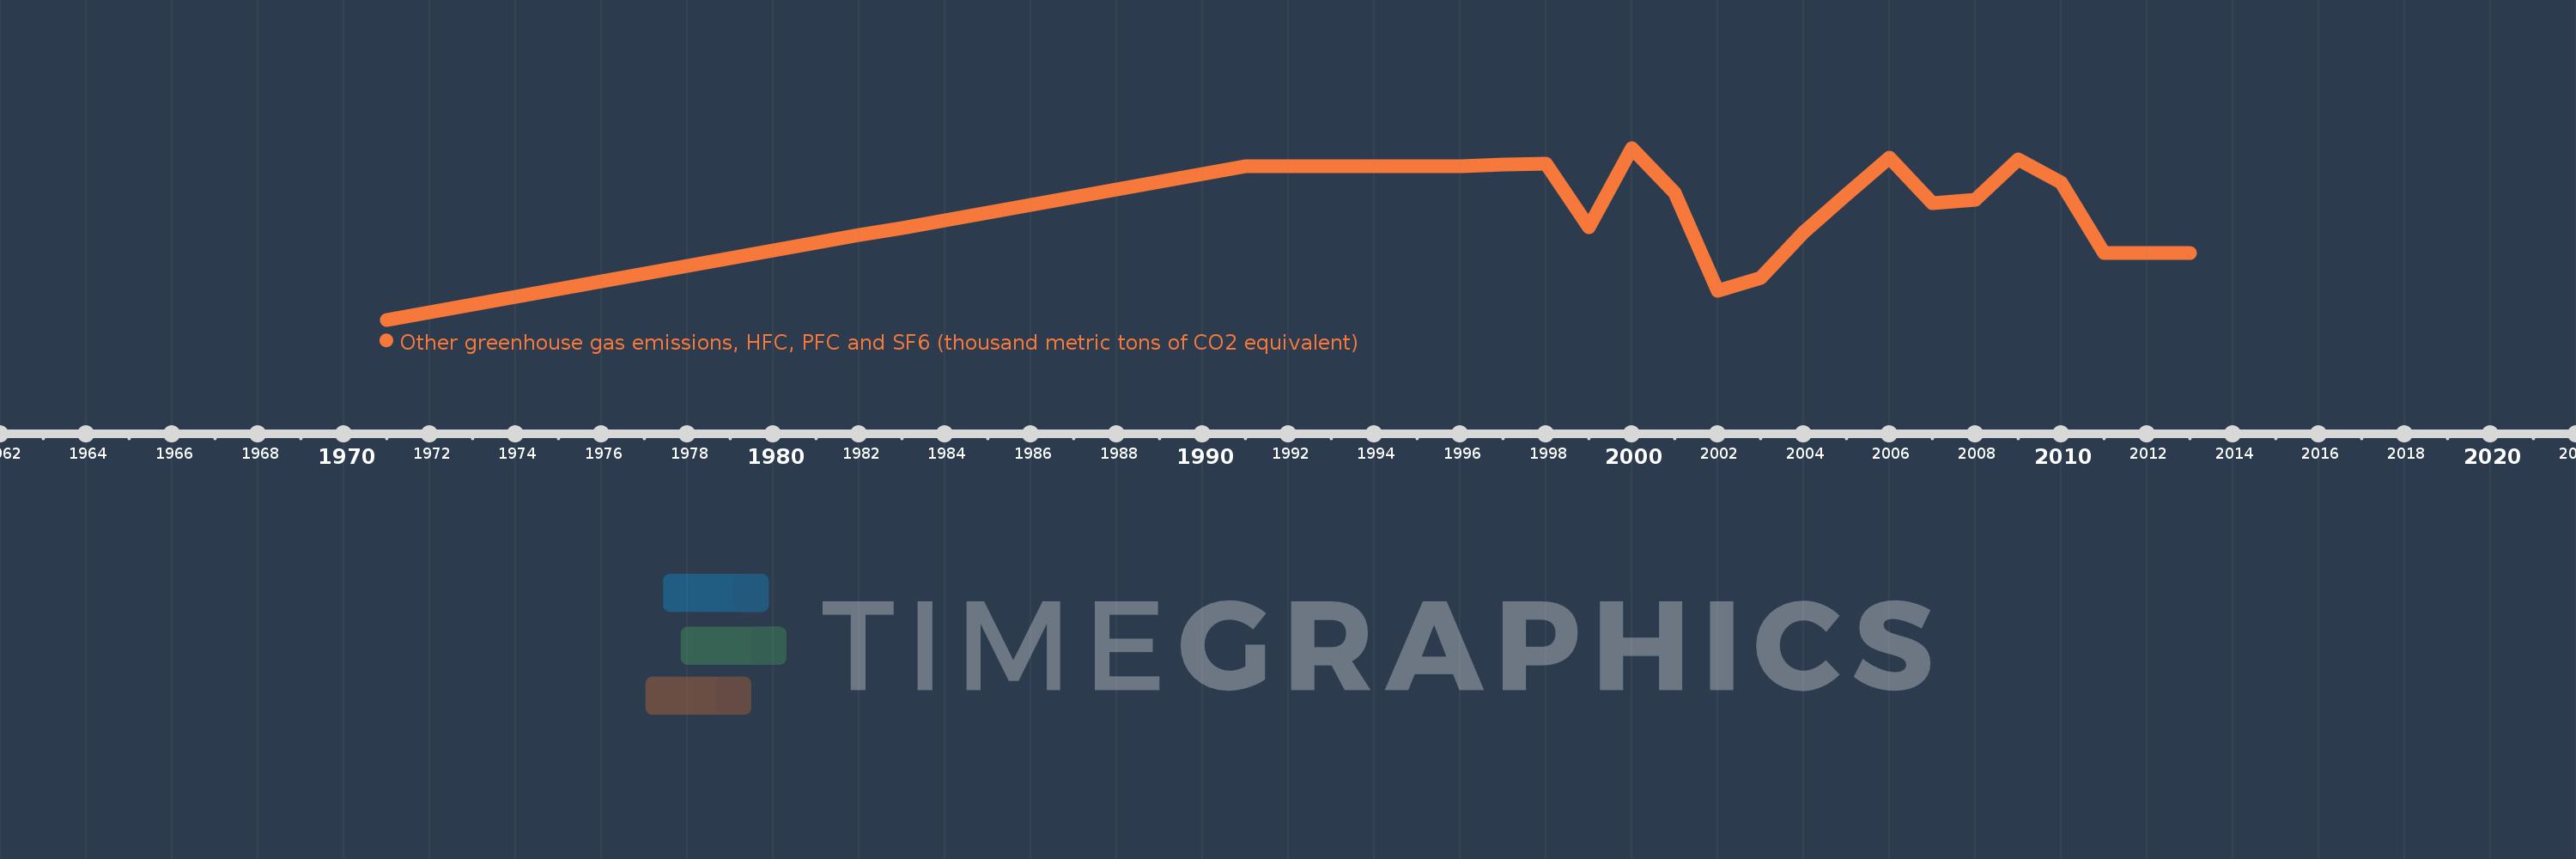
Other greenhouse gas emissions, HFC, PFC and SF6 (thousand metric tons of CO2 equivalent)
2013,2012,2011,2010,2009,2008,2007,2006,2005,2004,2003,2002,2001,2000,1999,1998,1997,1996,1995,1994,1993,1992,1991,1990,1989,1988,1987,1986,1985,1984,1983,1982,1981,1980,1979,1978,1977,1976,1975,1974,1973,1972,1971
This statistics in other country:
AfghanistanAlbaniaAlgeriaAmerican SamoaAngolaAntigua and BarbudaArab WorldArgentinaArmeniaArubaAustraliaAustriaAzerbaijanBahamas, TheBahrainBangladeshBarbadosBelarusBelgiumBelizeBeninBermudaBhutanBoliviaBosnia and HerzegovinaBotswanaBrazilBritish Virgin IslandsBrunei DarussalamBulgariaBurkina FasoBurundiCabo VerdeCambodiaCameroonCanadaCaribbean small statesCayman IslandsCentral African RepublicCentral Europe and the BalticsChadChileChinaColombiaComorosCongo, Dem. Rep.Congo, Rep.Costa RicaCote d'IvoireCroatiaCubaCyprusCzech RepublicDenmarkDjiboutiDominicaDominican RepublicEarly-demographic dividendEast Asia & PacificEast Asia & Pacific (excluding high income)East Asia & Pacific (IDA & IBRD countries)EcuadorEgypt, Arab Rep.El SalvadorEquatorial GuineaEritreaEstoniaEthiopiaEuro areaEurope & Central AsiaEurope & Central Asia (excluding high income)Europe & Central Asia (IDA & IBRD countries)European UnionFaroe IslandsFijiFinlandFragile and conflict affected situationsFranceFrench PolynesiaGabonGambia, TheGeorgiaGermanyGhanaGibraltarGreeceGreenlandGrenadaGuamGuatemalaGuineaGuinea-BissauGuyanaHaitiHeavily indebted poor countries (HIPC)High incomeHondurasHong Kong SAR, ChinaHungaryIBRD onlyIcelandIDA & IBRD totalIDA blendIDA onlyIDA totalIndiaIndonesiaIran, Islamic Rep.IraqIrelandIsraelItalyJamaicaJapanJordanKazakhstanKenyaKiribatiKorea, Dem. People’s Rep.Korea, Rep.KuwaitKyrgyz RepublicLao PDRLate-demographic dividendLatin America & Caribbean Latin America & Caribbean (excluding high income)Latin America & the Caribbean (IDA & IBRD countries)LatviaLeast developed countries: UN classificationLebanonLesothoLiberiaLibyaLithuaniaLow & middle incomeLow incomeLower middle incomeLuxembourgMacao SAR, ChinaMacedonia, FYRMadagascarMalawiMalaysiaMaldivesMaliMaltaMauritaniaMauritiusMexicoMiddle East & North AfricaMiddle East & North Africa (excluding high income)Middle East & North Africa (IDA & IBRD countries)Middle incomeMoldovaMongoliaMoroccoMozambiqueMyanmarNamibiaNauruNepalNetherlandsNew CaledoniaNew ZealandNicaraguaNigerNigeriaNorth AmericaNorwayOECD membersOmanOther small statesPacific island small statesPakistanPanamaPapua New GuineaParaguayPeruPhilippinesPolandPortugalPost-demographic dividendPre-demographic dividendPuerto RicoQatarRomaniaRussian FederationRwandaSamoaSao Tome and PrincipeSaudi ArabiaSenegalSeychellesSierra LeoneSingaporeSlovak RepublicSloveniaSmall statesSolomon IslandsSomaliaSouth AfricaSouth AsiaSouth Asia (IDA & IBRD)SpainSri LankaSt. Kitts and NevisSt. LuciaSt. Vincent and the GrenadinesSub-Saharan Africa Sub-Saharan Africa (excluding high income)Sub-Saharan Africa (IDA & IBRD countries)SudanSurinameSwazilandSwedenSwitzerlandSyrian Arab RepublicTajikistanTanzaniaThailandTimor-LesteTogoTongaTrinidad and TobagoTunisiaTurkeyTurkmenistanTurks and Caicos IslandsTuvaluUgandaUkraineUnited Arab EmiratesUnited KingdomUnited StatesUpper middle incomeUruguayUzbekistanVanuatuVenezuela, RBVietnamVirgin Islands (U.S.)WorldYemen, Rep.ZambiaZimbabwe Timeline:
This timeline shows a graph from 1971 to 2013 of Uruguay. No data until 1970. Number of actual observations by date: 43.
Source name:
World Development Indicators
Source organization:
World Bank staff estimates from original source: European Commission, Joint Research Centre (JRC)/Netherlands Environmental Assessment Agency (PBL). Emission Database for Global Atmospheric Research (EDGAR): http://edgar.jrc.ec.europa.eu/.
Categories, topics:
Climate Change, Environment
Last updated:
apr 23, 2017
Indicators value changes by year
Maximum:
452.515
jan 1, 2000
At the date of observation
Value
Absolute change
Change from previous value
jan 1, 1972
20.2
+20.2
740.34 trl%
jan 1, 1973
40.4
+20.2
100.0%
jan 1, 1974
60.6
+20.2
50.0%
jan 1, 1975
80.8
+20.2
33.33%
jan 1, 1976
101.0
+20.2
25.0%
jan 1, 1977
121.2
+20.2
20.0%
jan 1, 1978
141.4
+20.2
16.67%
jan 1, 1979
161.6
+20.2
14.29%
jan 1, 1980
181.8
+20.2
12.5%
jan 1, 1981
202.0
+20.2
11.11%
jan 1, 1982
222.2
+20.2
10.0%
jan 1, 1983
242.4
+20.2
9.09%
jan 1, 1984
262.6
+20.2
8.33%
jan 1, 1985
282.8
+20.2
7.69%
jan 1, 1986
303.0
+20.2
7.14%
jan 1, 1987
323.2
+20.2
6.67%
jan 1, 1988
343.4
+20.2
6.25%
jan 1, 1989
363.6
+20.2
5.88%
jan 1, 1990
383.8
+20.2
5.56%
jan 1, 1991
404.005
+20.205
5.26%
jan 1, 1992
403.809
-0.196
-0.05%
jan 1, 1993
403.673
-0.136
-0.03%
jan 1, 1994
403.812
+0.139
0.03%
jan 1, 1995
404.352
+0.54
0.13%
jan 1, 1996
405.318
+0.966
0.24%
jan 1, 1997
408.118
+2.8
0.69%
jan 1, 1998
411.544
+3.426
0.84%
jan 1, 1999
242.565
-168.979
-41.06%
jan 1, 2000
452.515
+209.95
86.55%
jan 1, 2001
335.193
-117.322
-25.93%
jan 1, 2002
77.158
-258.035
-76.98%
jan 1, 2003
111.211
+34.053
44.13%
jan 1, 2004
230.155
+118.944
106.95%
jan 1, 2005
328.818
+98.663
42.87%
jan 1, 2006
428.075
+99.257
30.19%
jan 1, 2007
307.211
-120.864
-28.23%
jan 1, 2008
315.05
+7.839
2.55%
jan 1, 2009
421.683
+106.633
33.85%
jan 1, 2010
360.226
-61.457
-14.57%
jan 1, 2011
175.103
-185.123
-51.39%
jan 1, 2012
175.103
+0.0
0.0%
jan 1, 2013
175.103
0.0
0.0%
Ranking of countries by current statistics by years


Comments: