29
/
en
AIzaSyAYiBZKx7MnpbEhh9jyipgxe19OcubqV5w
April 1, 2024
143340
Grenada
GRD
true
2
1
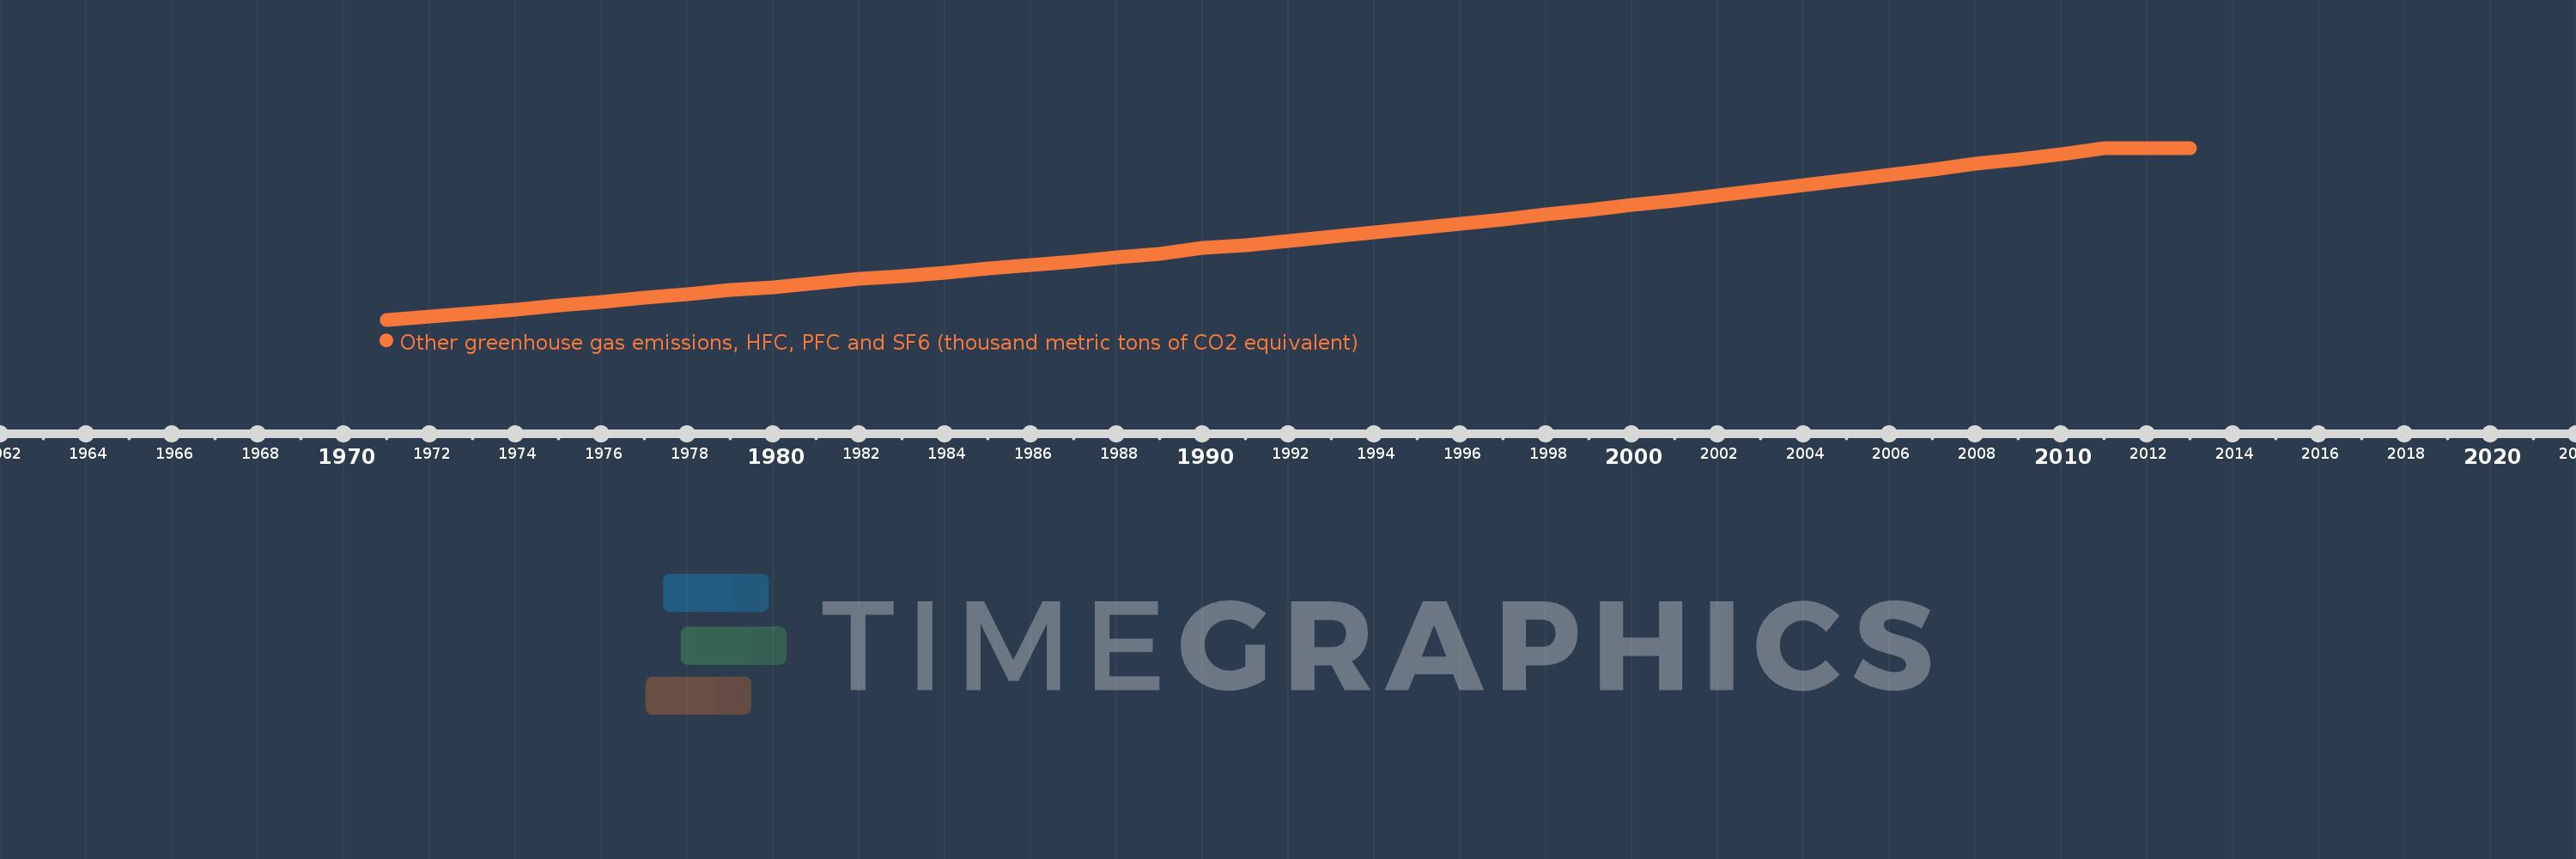
Other greenhouse gas emissions, HFC, PFC and SF6 (thousand metric tons of CO2 equivalent)
2013,2012,2011,2010,2009,2008,2007,2006,2005,2004,2003,2002,2001,2000,1999,1998,1997,1996,1995,1994,1993,1992,1991,1990,1989,1988,1987,1986,1985,1984,1983,1982,1981,1980,1979,1978,1977,1976,1975,1974,1973,1972,1971
This statistics in other country:
AfghanistanAlbaniaAlgeriaAmerican SamoaAngolaAntigua and BarbudaArab WorldArgentinaArmeniaArubaAustraliaAustriaAzerbaijanBahamas, TheBahrainBangladeshBarbadosBelarusBelgiumBelizeBeninBermudaBhutanBoliviaBosnia and HerzegovinaBotswanaBrazilBritish Virgin IslandsBrunei DarussalamBulgariaBurkina FasoBurundiCabo VerdeCambodiaCameroonCanadaCaribbean small statesCayman IslandsCentral African RepublicCentral Europe and the BalticsChadChileChinaColombiaComorosCongo, Dem. Rep.Congo, Rep.Costa RicaCote d'IvoireCroatiaCubaCyprusCzech RepublicDenmarkDjiboutiDominicaDominican RepublicEarly-demographic dividendEast Asia & PacificEast Asia & Pacific (excluding high income)East Asia & Pacific (IDA & IBRD countries)EcuadorEgypt, Arab Rep.El SalvadorEquatorial GuineaEritreaEstoniaEthiopiaEuro areaEurope & Central AsiaEurope & Central Asia (excluding high income)Europe & Central Asia (IDA & IBRD countries)European UnionFaroe IslandsFijiFinlandFragile and conflict affected situationsFranceFrench PolynesiaGabonGambia, TheGeorgiaGermanyGhanaGibraltarGreeceGreenlandGrenadaGuamGuatemalaGuineaGuinea-BissauGuyanaHaitiHeavily indebted poor countries (HIPC)High incomeHondurasHong Kong SAR, ChinaHungaryIBRD onlyIcelandIDA & IBRD totalIDA blendIDA onlyIDA totalIndiaIndonesiaIran, Islamic Rep.IraqIrelandIsraelItalyJamaicaJapanJordanKazakhstanKenyaKiribatiKorea, Dem. People’s Rep.Korea, Rep.KuwaitKyrgyz RepublicLao PDRLate-demographic dividendLatin America & Caribbean Latin America & Caribbean (excluding high income)Latin America & the Caribbean (IDA & IBRD countries)LatviaLeast developed countries: UN classificationLebanonLesothoLiberiaLibyaLithuaniaLow & middle incomeLow incomeLower middle incomeLuxembourgMacao SAR, ChinaMacedonia, FYRMadagascarMalawiMalaysiaMaldivesMaliMaltaMauritaniaMauritiusMexicoMiddle East & North AfricaMiddle East & North Africa (excluding high income)Middle East & North Africa (IDA & IBRD countries)Middle incomeMoldovaMongoliaMoroccoMozambiqueMyanmarNamibiaNauruNepalNetherlandsNew CaledoniaNew ZealandNicaraguaNigerNigeriaNorth AmericaNorwayOECD membersOmanOther small statesPacific island small statesPakistanPanamaPapua New GuineaParaguayPeruPhilippinesPolandPortugalPost-demographic dividendPre-demographic dividendPuerto RicoQatarRomaniaRussian FederationRwandaSamoaSao Tome and PrincipeSaudi ArabiaSenegalSeychellesSierra LeoneSingaporeSlovak RepublicSloveniaSmall statesSolomon IslandsSomaliaSouth AfricaSouth AsiaSouth Asia (IDA & IBRD)SpainSri LankaSt. Kitts and NevisSt. LuciaSt. Vincent and the GrenadinesSub-Saharan Africa Sub-Saharan Africa (excluding high income)Sub-Saharan Africa (IDA & IBRD countries)SudanSurinameSwazilandSwedenSwitzerlandSyrian Arab RepublicTajikistanTanzaniaThailandTimor-LesteTogoTongaTrinidad and TobagoTunisiaTurkeyTurkmenistanTurks and Caicos IslandsTuvaluUgandaUkraineUnited Arab EmiratesUnited KingdomUnited StatesUpper middle incomeUruguayUzbekistanVanuatuVenezuela, RBVietnamVirgin Islands (U.S.)WorldYemen, Rep.ZambiaZimbabwe Timeline:
This timeline shows a graph from 1971 to 2013 of Grenada. No data until 1970. Number of actual observations by date: 43.
Source name:
World Development Indicators
Source organization:
World Bank staff estimates from original source: European Commission, Joint Research Centre (JRC)/Netherlands Environmental Assessment Agency (PBL). Emission Database for Global Atmospheric Research (EDGAR): http://edgar.jrc.ec.europa.eu/.
Categories, topics:
Climate Change, Environment
Last updated:
apr 23, 2017
Indicators value changes by year
At the date of observation
Value
Absolute change
Change from previous value
jan 1, 1971
1.09
+1.09
0.0%
jan 1, 1972
1.12
+0.03
2.77%
jan 1, 1973
1.151
+0.03
2.7%
jan 1, 1974
1.181
+0.03
2.62%
jan 1, 1975
1.221
+0.04
3.41%
jan 1, 1976
1.251
+0.03
2.47%
jan 1, 1977
1.291
+0.04
3.21%
jan 1, 1978
1.322
+0.03
2.35%
jan 1, 1979
1.362
+0.04
3.04%
jan 1, 1980
1.392
+0.03
2.22%
jan 1, 1981
1.432
+0.04
2.86%
jan 1, 1982
1.466
+0.034
2.37%
jan 1, 1983
1.494
+0.028
1.91%
jan 1, 1984
1.528
+0.034
2.28%
jan 1, 1985
1.566
+0.038
2.49%
jan 1, 1986
1.599
+0.033
2.11%
jan 1, 1987
1.629
+0.03
1.88%
jan 1, 1988
1.671
+0.042
2.58%
jan 1, 1989
1.701
+0.03
1.8%
jan 1, 1990
1.752
+0.051
3.0%
jan 1, 1991
1.782
+0.03
1.71%
jan 1, 1992
1.816
+0.034
1.91%
jan 1, 1993
1.854
+0.038
2.09%
jan 1, 1994
1.897
+0.043
2.32%
jan 1, 1995
1.936
+0.039
2.06%
jan 1, 1996
1.979
+0.043
2.22%
jan 1, 1997
2.019
+0.04
2.02%
jan 1, 1998
2.061
+0.042
2.08%
jan 1, 1999
2.101
+0.04
1.94%
jan 1, 2000
2.152
+0.051
2.43%
jan 1, 2001
2.192
+0.04
1.86%
jan 1, 2002
2.236
+0.044
2.01%
jan 1, 2003
2.284
+0.048
2.15%
jan 1, 2004
2.337
+0.053
2.32%
jan 1, 2005
2.385
+0.048
2.05%
jan 1, 2006
2.429
+0.044
1.84%
jan 1, 2007
2.475
+0.046
1.89%
jan 1, 2008
2.531
+0.056
2.26%
jan 1, 2009
2.576
+0.045
1.78%
jan 1, 2010
2.622
+0.046
1.79%
jan 1, 2011
2.678
+0.056
2.14%
jan 1, 2012
2.678
0.0
0.0%
jan 1, 2013
2.678
+0.0
0.0%
Ranking of countries by current statistics by years


Comments: